Ethereum Price Plunges to $1,550: Can Bulls Save the Day?
Ethereum started a downside correction from the $1,675 high against the US Dollar. ETH must stay above the $1,550 support to start a fresh increase. Ethereum climbed higher above $1,650 before it started a downside corre...

Ethereum started a downside correction from the $1,675 high against the US Dollar. ETH must stay above the $1,550 support to start a fresh increase.
- Ethereum climbed higher above $1,650 before it started a downside correction.
- The price is now trading below $1,600 and the 100 hourly simple moving average.
- There is a key bearish trend line forming with resistance near $1,605 on the hourly chart of ETH/USD (data feed via Kraken).
- The pair could rise steadily if it clears the $1,600 and $1,615 resistance levels.
Ethereum remained well bid above the $1,550 support zone. ETH started a fresh increase and was able to clear the $1,600 resistance zone and the 100 hourly simple moving average.
The price even broke the $1,650 level, but there was no test of $1,700. A high was formed near $1,675 and the price started a downside correction. There was a move below the $1,620 and $1,600 level. Ether price declined below the 50% Fib retracement level of the upward move from the $1,501 swing low to $1,675 high.
The price tested the $1,560 support zone. It stayed above the 61.8% Fib retracement level of the upward move from the $1,501 swing low to $1,675 high.
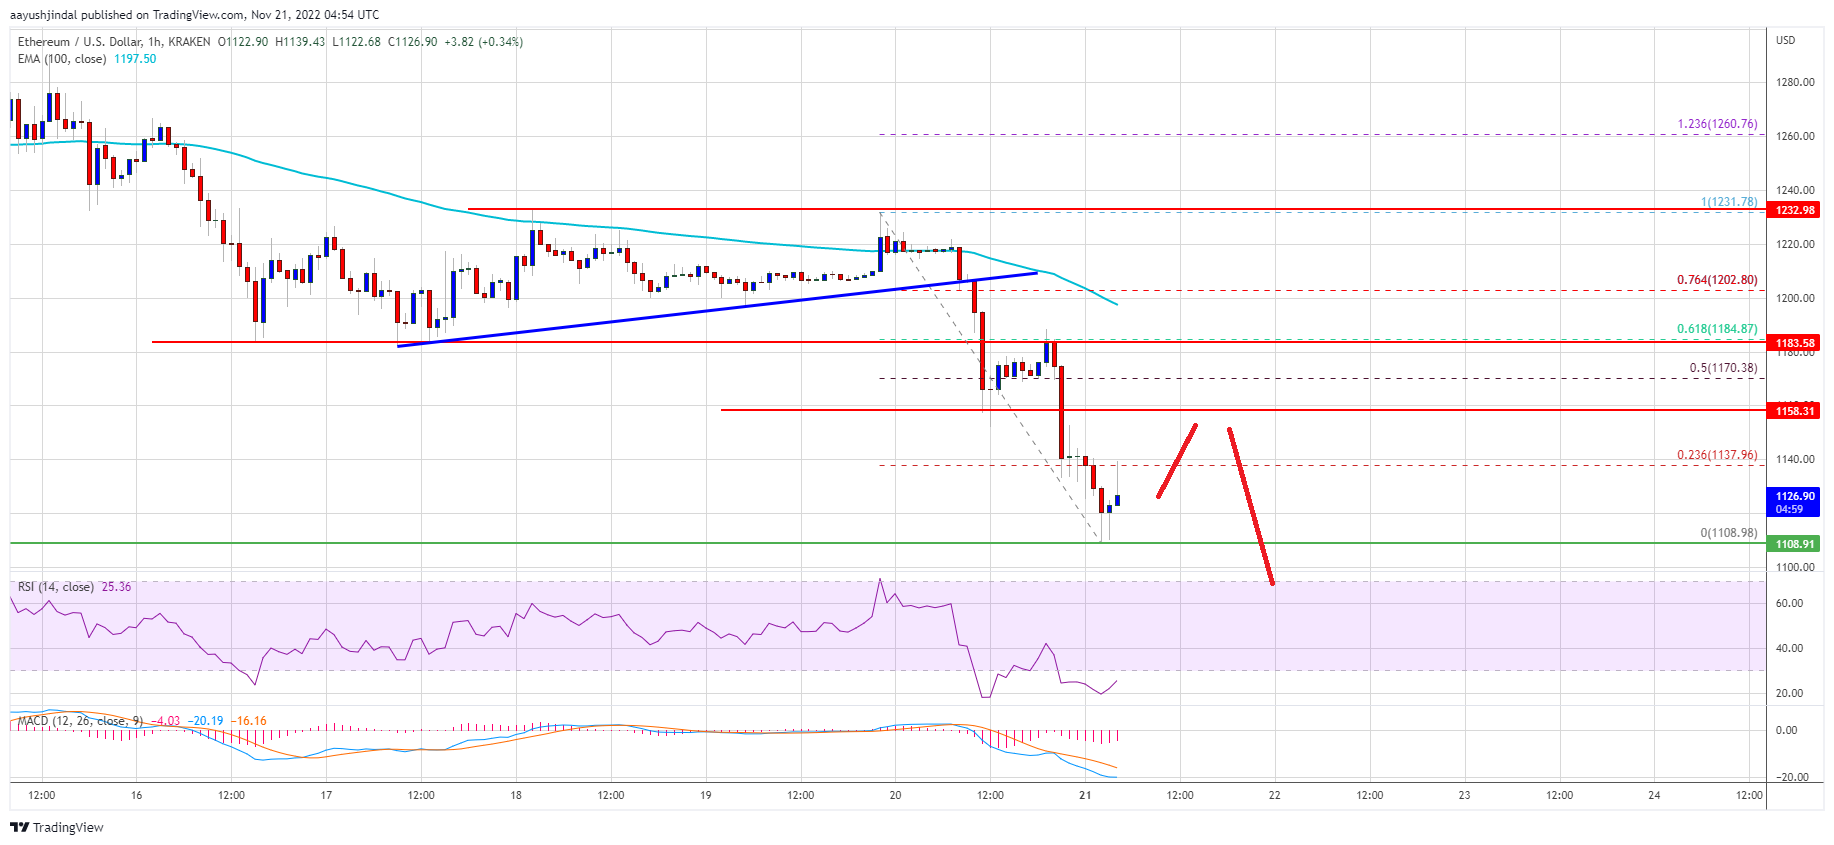
Ether is now consolidating losses below $1,600 and the 100 hourly simple moving average. An immediate resistance on the upside is near the $1,600 level. There is also a key bearish trend line forming with resistance near $1,605 on the hourly chart of ETH/USD.
Source: ETHUSD on TradingView.com
The next major resistance is near the $1,615 level. A clear break above the $1,615 resistance could set the pace for a decent increase. In the stated case, the price could rise to the $1,675 level. Any more gains might send the price toward the $1,720 resistance zone.
More Losses in ETH?If ethereum fails to climb above the $1,615 resistance, it could start another decline. An initial support on the downside is near the $1,560 level.
The next major support is near the $1,550 level, below which ether price may perhaps gain bearish momentum. In the stated scenario, the price could decline towards the $1,500 support zone in the near term.
Technical Indicators
Hourly MACD – The MACD for ETH/USD is now losing momentum in the bearish zone.
Hourly RSI – The RSI for ETH/USD is now below the 50 level.
Major Support Level – $1,560
Major Resistance Level – $1,615
Original source
Read on NewsBTCRelated market context

Standard Chartered Says Bitcoin Bottomed Near $59,000 As Crypto Winter Ends
TL;DR Standard Chartered’s Geoffrey Kendrick reportedly says Bitcoin’s $59,000 area marked the cycle bottom. The note cites SpaceX...

Bitcoin price challenges $64,000 weekend wall – needing a breakout or risk a deeper correction
Bitcoin reclaimed $64,000 on June 12 and touched an intraday high of $64,301 in the same session that spot ETF flows finally flipp...

Elon Musk SpaceX AI Predicts Incredible Bitcoin Price For Next 30 Days
Here is the thing about capitulation calls. They only sound smart in hindsight. Right now, with Bitcoin price scraping along the l...

Bitcoin Mining Cost Model Points To $47,000 Floor, But Analysts Urge Caution
TL;DR Crypto Rover says Bitcoin has never bottomed below electrical production cost, currently estimated at $47,000. Mining-cost m...

Bitcoin rises above $64,000 after Pakistan prime minister says Iran peace deal is near
Bitcoin traded above $64,000 on Saturday, supported by its strongest ETF inflows in a month and growing optimism around geopolitic...

Google Gemini AI Predicts Jaw-Dropping XRP Price For Next 90 Days
Google Gemini AI just put XRP back under the spotlight, predicting it is tightly wound for a major breakout toward $1.60 to $1.80...