Ethereum Price Prediction- After 10% Surge, Is ETH Rally Just Getting Started?
Ethereum price extended its rally above the $2,250 resistance. ETH is up over 10% and might continue to rise toward the $2,500 resistance. Ethereum is showing positive signs and recently surpassed the $2,300 resistance....

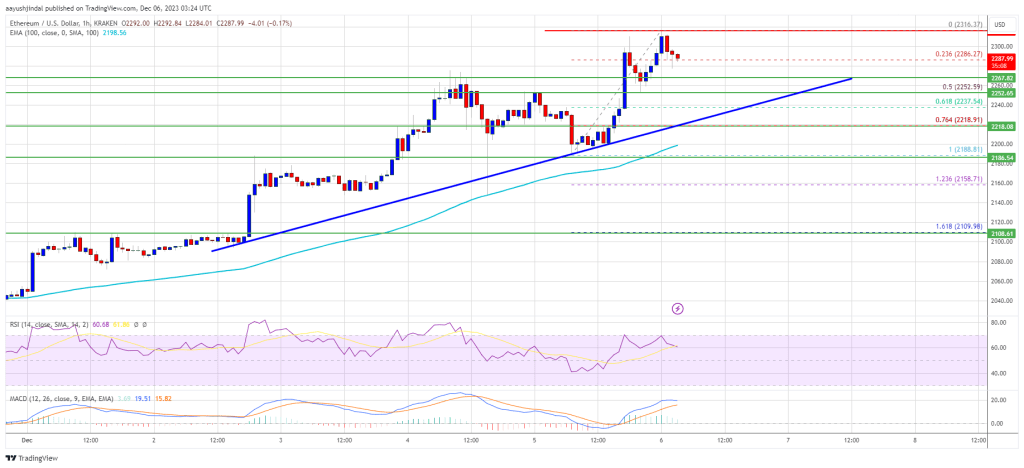
Ethereum price extended its rally above the $2,250 resistance. ETH is up over 10% and might continue to rise toward the $2,500 resistance.
- Ethereum is showing positive signs and recently surpassed the $2,300 resistance.
- The price is trading above $2,250 and the 100-hourly Simple Moving Average.
- There is a major bullish trend line forming with support near $2,250 on the hourly chart of ETH/USD (data feed via Kraken).
- The pair could extend its rally if it clears the $2,320 resistance zone.
Ethereum price remained in a positive zone above $2,120, like Bitcoin. ETH extended its rally above the $2,200 and $2,250 resistance levels. The bulls remained action and the price spiked above $2,300.
A new multi-month high was formed near $2,316 and the price is now correcting gains. There was a move below the $2,300 level. The price is now testing the 23.6% Fib retracement level of the upward move from the $2,188 swing low to the $2,316 high.
Ethereum is now trading above $2,250 and the 100-hourly Simple Moving Average. Besides, there is a major bullish trend line forming with support near $2,250 on the hourly chart of ETH/USD.
Source: ETHUSD on TradingView.com
On the upside, the price is facing resistance near the $2,320 zone. The next key resistance is near the $2,350 level. A clear move above the $2,350 zone could send the price toward the $2,420 level. The next resistance sits at $2,450. Any more gains could start a wave toward the $2,500 level.
Are Dips Supported in ETH?If Ethereum fails to clear the $2,320 resistance, it could start a downside correction. Initial support on the downside is near the $2,265 level.
The next key support is $2,250 and the trend line. It is near the 50% Fib retracement level of the upward move from the $2,188 swing low to the $2,316 high. The main support is now near $2,200 or the 100-hourly Simple Moving Average. A downside break below $2,200 might start an extended decline. The key support is now at $2,120, below which there is a risk of a move toward the $2,080 level in the near term.
Technical Indicators
Hourly MACD – The MACD for ETH/USD is gaining momentum in the bullish zone.
Hourly RSI – The RSI for ETH/USD is now above the 50 level.
Major Support Level – $2,200
Major Resistance Level – $2,320
Original source
Read on NewsBTCRelated market context

Tether USDT Briefly Overtakes Ethereum in Market Cap: A $187B Wake-Up Call
For a few hours, earlier this week, Tether USDT stablecoin held a higher market cap than Ethereum, the first time that has happene...

Uranium Holds Above $85 as Mining ETF Rebounds From June Sell-Off
The latest charts display that the market is divided into stable physical prices and uranium shares trying to regain momentum afte...

Standard Chartered Says Bitcoin Bottomed Near $59,000 As Crypto Winter Ends
TL;DR Standard Chartered’s Geoffrey Kendrick reportedly says Bitcoin’s $59,000 area marked the cycle bottom. The note cites SpaceX...

Elon Musk SpaceX AI Predicts Incredible Bitcoin Price For Next 30 Days
Here is the thing about capitulation calls. They only sound smart in hindsight. Right now, with Bitcoin price scraping along the l...

Elon Musk’s trillionaire status puts his net worth above crypto’s entire market cap outside Bitcoin
Elon Musk has become the first person in modern history to amass a personal net worth exceeding $1 trillion, crossing the historic...

Google Gemini AI Predicts Jaw-Dropping XRP Price For Next 90 Days
Google Gemini AI just put XRP back under the spotlight, predicting it is tightly wound for a major breakout toward $1.60 to $1.80...