Ethereum Price Primed To Test $2,000, These Could Be The Factors To Watch
Ethereum price is moving higher above the $1,900 resistance against the US dollar. ETH could accelerate higher toward $2,000 or even $2,120 in the coming sessions. Ethereum is showing positive signs above the $1,900 leve...

Ethereum price is moving higher above the $1,900 resistance against the US dollar. ETH could accelerate higher toward $2,000 or even $2,120 in the coming sessions.
- Ethereum is showing positive signs above the $1,900 level.
- The price is trading above $1,880 and the 100-hourly Simple Moving Average.
- There is a connecting bullish trend line forming with support near $1,905 on the hourly chart of ETH/USD (data feed via Kraken).
- The pair could continue to move higher toward the $2,000 barrier in the near term.
Ethereum is forming a base above the $1,850 support zone. ETH remained in a bullish zone and slowly moved higher above the $1,880 resistance, like Bitcoin.
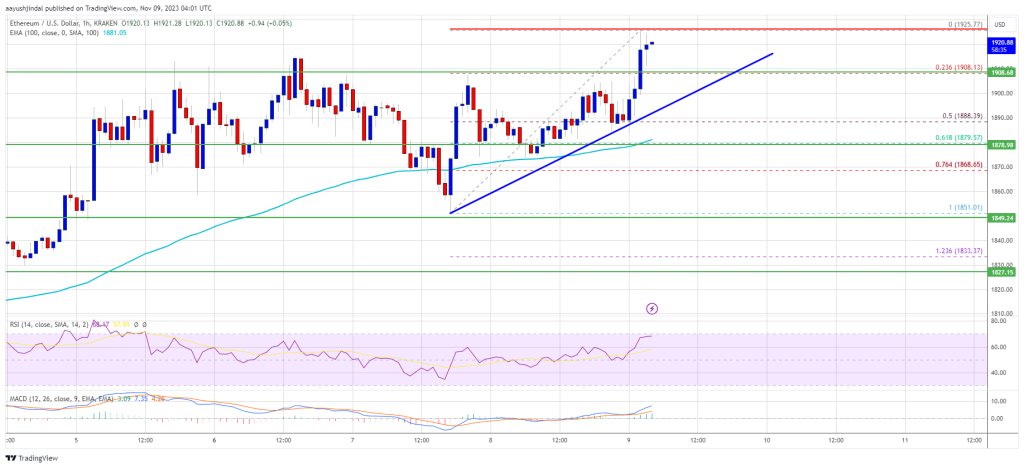
There was also a move above the $1,920 resistance. The price traded to a new multi-week high at $1,925 and is currently consolidating gains. The current price action is positive above the 23.6% Fib retracement level of the recent wave from the $1,852 swing low to the $1,925 high.
Ethereum is trading above $1,880 and the 100-hourly Simple Moving Average. There is also a connecting bullish trend line forming with support near $1,905 on the hourly chart of ETH/USD.
Source: ETHUSD on TradingView.com
On the upside, the price is facing resistance near the $1,925 level. The next major resistance sits at $1,950, above which the price could accelerate higher. In the stated case, the price could rally toward the $2,000 resistance. The next key resistance is near $2,050, above which the price could aim for a move toward the $2,120 level.
Are Dips Supported in ETH?If Ethereum fails to clear the $1,925 resistance, it could start a downside correction. Initial support on the downside is near the $1,905 level and the trend line.
The next key support is $1,880 or the 100 hourly SMA or the 61.8% Fib retracement level of the recent wave from the $1,852 swing low to the $1,925 high. The main support sits at $1,850. A downside break below the $1,850 support might spark bearish moves. In the stated case, Ether could drop toward the $1,780 level.
Technical Indicators
Hourly MACD – The MACD for ETH/USD is gaining momentum in the bullish zone.
Hourly RSI – The RSI for ETH/USD is now above the 50 level.
Major Support Level – $1,880
Major Resistance Level – $1,950
Original source
Read on NewsBTCRelated market context

Tether USDT Briefly Overtakes Ethereum in Market Cap: A $187B Wake-Up Call
For a few hours, earlier this week, Tether USDT stablecoin held a higher market cap than Ethereum, the first time that has happene...

Wall Street is moving past crypto pilots and deeper into Ethereum, says Etherealize founder
In an interview with CoinDesk, Etherealize cofounder Vivek Raman said Ethereum is currently in a transitional phase where the infr...

Fireblocks Says Institutional ETH Staking Is Moving Toward Standardized Rails
TL;DR Fireblocks says it has launched ETH Staking Link, a standardized interface for institutional Ethereum staking integrations....

Standard Chartered Says Bitcoin Bottomed Near $59,000 As Crypto Winter Ends
TL;DR Standard Chartered’s Geoffrey Kendrick reportedly says Bitcoin’s $59,000 area marked the cycle bottom. The note cites SpaceX...

Uranium Holds Above $85 as Mining ETF Rebounds From June Sell-Off
The latest charts display that the market is divided into stable physical prices and uranium shares trying to regain momentum afte...

Michael Saylor says investor confidence in Ethereum has collapsed
Ethereum's declining investor confidence signals a shift towards Bitcoin dominance, emphasizing real-world utility over speculativ...