Ethereum Price Prints Bullish Signal, What Are Possible Bulls Targets
Ethereum gained pace and retested the $1,300 resistance zone against the US Dollar. ETH is eyeing more gains towards the $1,330 and $1,350 levels. Ethereum remained well bid above the $1,240 level and resumed its increas...

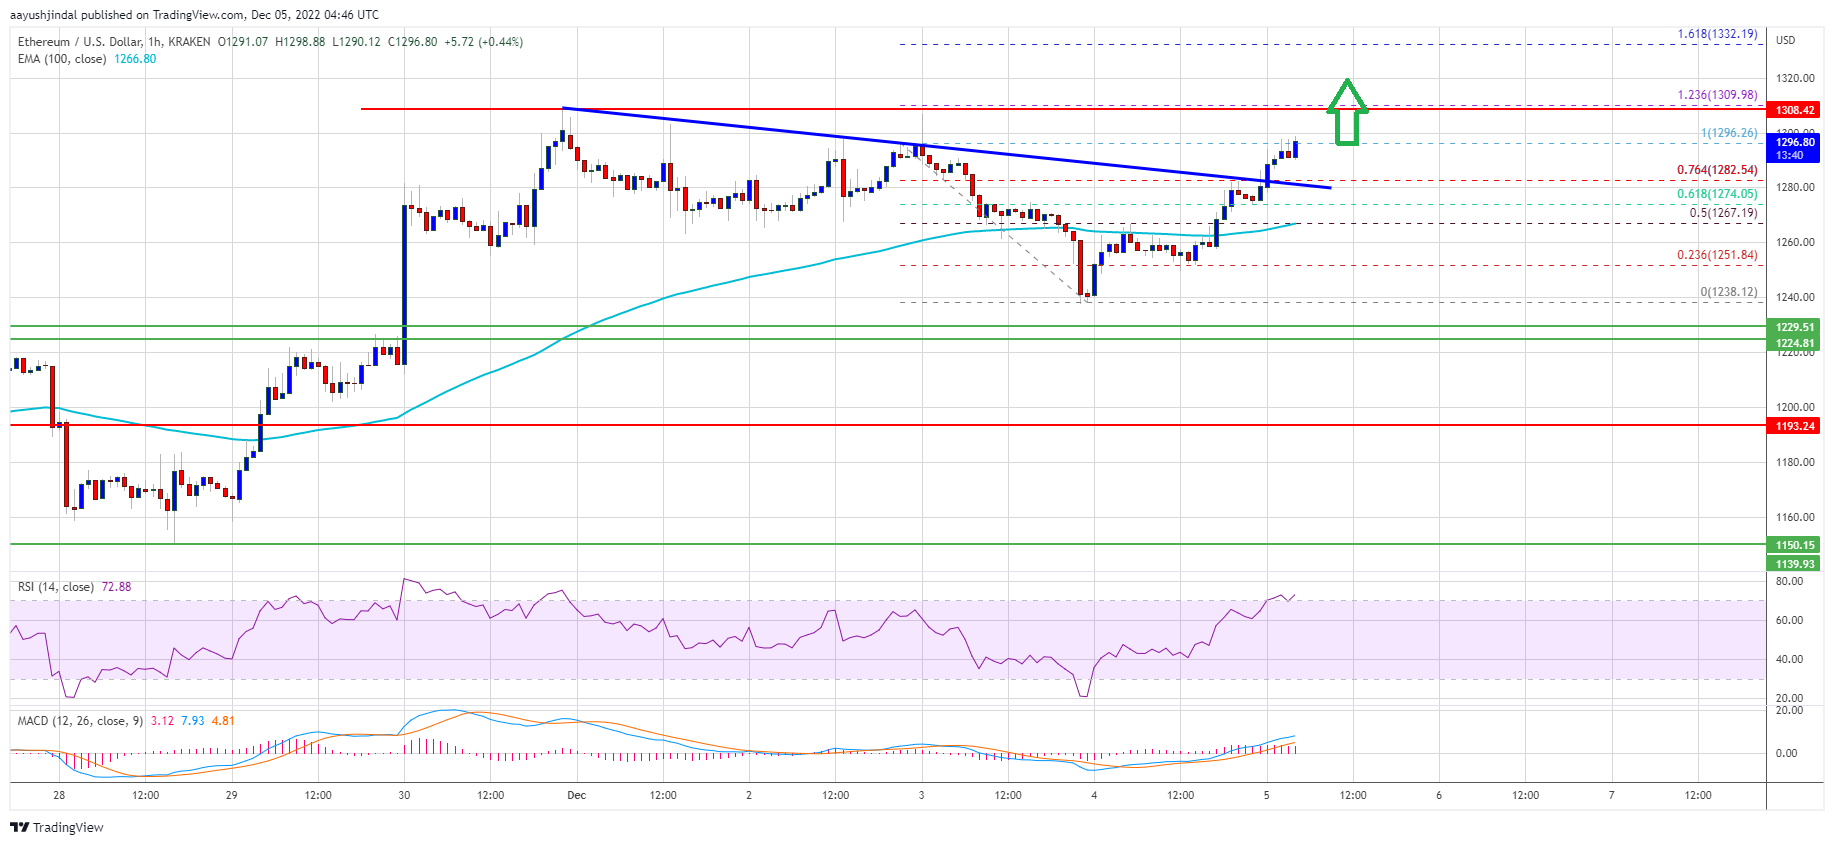
Ethereum gained pace and retested the $1,300 resistance zone against the US Dollar. ETH is eyeing more gains towards the $1,330 and $1,350 levels.
- Ethereum remained well bid above the $1,240 level and resumed its increase.
- The price is now trading above $1,250 and the 100 hourly simple moving average.
- There was a break above a major bearish trend line with resistance near $1,280 on the hourly chart of ETH/USD (data feed via Kraken).
- The pair could gain bullish momentum once it settles above the $1,300 resistance zone.
Ethereum price corrected lower once from the $1,300 resistance zone. ETH declined below the $1,280 support level. However, the bulls were active above the $1,240 level and the 100 hourly simple moving average, similar to bitcoin.
The price traded as low as $1,238 and recently started a fresh increase. Ether price traded above the $1,275 and $1,280 resistance levels. It cleared the 76.4% Fib retracement level of the downward move from the $1,296 swing high to $1,238 low.
Besides, there was a break above a major bearish trend line with resistance near $1,280 on the hourly chart of ETH/USD. The pair is now trading above $1,250 and the 100 hourly simple moving average.
An immediate resistance on the upside is near the $1,310 level. The first major resistance is near the $1,332 level. It is near the 1.618 Fib extension level of the downward move from the $1,296 swing high to $1,238 low. A close above the $1,332 resistance might send the price further higher.
Source: ETHUSD on TradingView.com
The next major resistance is near the $1,350 level, above which ether price might test $1,400. Any more gains might send the price towards the $1,500 resistance zone.
Less Downsides in ETH?If ethereum fails to start another increase above the $1,300 resistance, it could start a downside correction. An initial support on the downside is near the $1,280 level and the broken trend line.
The next major support is near the $1,265 level or the 100 hourly simple moving average. If there is a break below $1,265, the price could test the $1,240 support. Any more losses could lead the price towards the $1,200 support.
Technical Indicators
Hourly MACD – The MACD for ETH/USD is now gaining momentum in the bullish zone.
Hourly RSI – The RSI for ETH/USD is now above the 50 level.
Major Support Level – $1,265
Major Resistance Level – $1,310
Original source
Read on NewsBTCRelated market context

Standard Chartered Says Bitcoin Bottomed Near $59,000 As Crypto Winter Ends
TL;DR Standard Chartered’s Geoffrey Kendrick reportedly says Bitcoin’s $59,000 area marked the cycle bottom. The note cites SpaceX...

Uranium Holds Above $85 as Mining ETF Rebounds From June Sell-Off
The latest charts display that the market is divided into stable physical prices and uranium shares trying to regain momentum afte...

Google Gemini AI Predicts Jaw-Dropping XRP Price For Next 90 Days
Google Gemini AI just put XRP back under the spotlight, predicting it is tightly wound for a major breakout toward $1.60 to $1.80...

Bitcoin rises above $64,000 after Pakistan prime minister says Iran peace deal is near
Bitcoin traded above $64,000 on Saturday, supported by its strongest ETF inflows in a month and growing optimism around geopolitic...

Fireblocks Says Institutional ETH Staking Is Moving Toward Standardized Rails
TL;DR Fireblocks says it has launched ETH Staking Link, a standardized interface for institutional Ethereum staking integrations....

Bitcoin price faces new risk as big buyers lose conviction
Bitcoin’s largest buyers are no longer behaving like a reliable backstop for the largest cryptocurrency. The exchange-traded funds...