Ethereum Price Rally Hits Wall at $2,150 After Explosive 15% Move
Ethereum price started a major rally above the $2,000 resistance. ETH is now correcting gains from $2,150 and might decline to $2,000. Ethereum started a fresh upward move above the $1,950 zone. The price is trading abov...

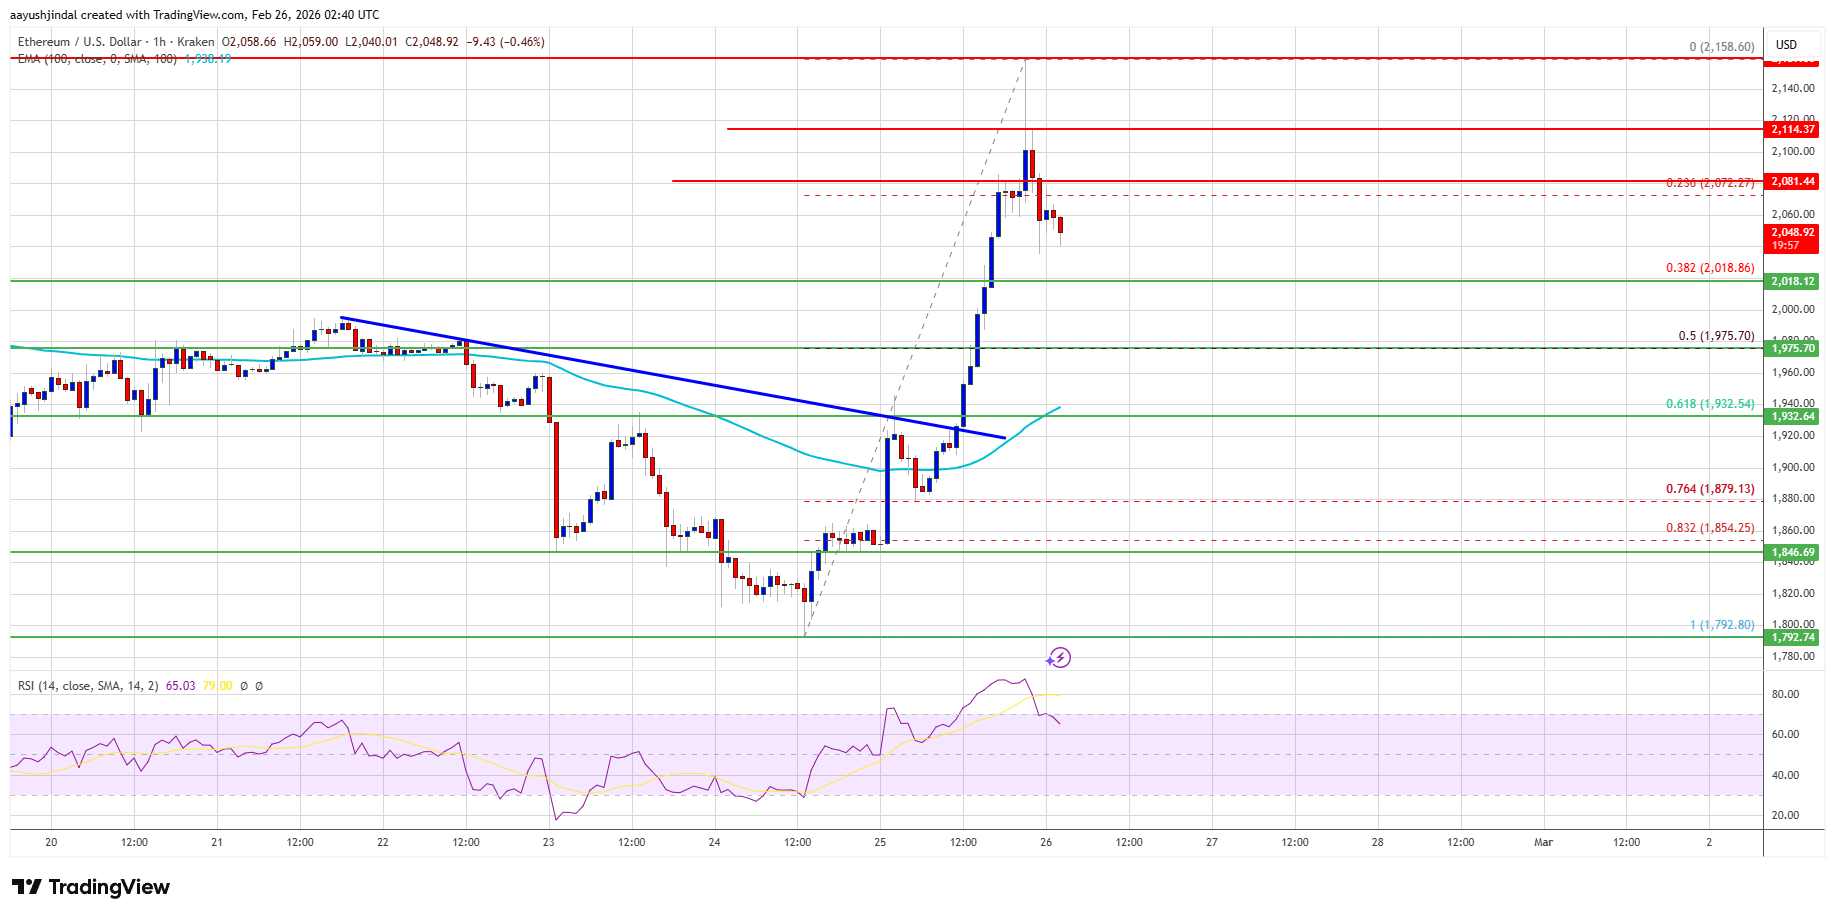
Ethereum price started a major rally above the $2,000 resistance. ETH is now correcting gains from $2,150 and might decline to $2,000.
- Ethereum started a fresh upward move above the $1,950 zone.
- The price is trading above $2,000 and the 100-hourly Simple Moving Average.
- There was a break above a bearish trend line with resistance at $1,920 on the hourly chart of ETH/USD (data feed via Kraken).
- The pair could start a fresh decline if it stays below the $2,120 zone.
Ethereum price managed to form a base and traded above the $1,920 resistance, like Bitcoin. ETH price rallied above the $2,000 and $2,020 resistance levels.
There was a break above a bearish trend line with resistance at $1,920 on the hourly chart of ETH/USD. The bulls even pumped the price above $2,100. A high was formed at $2,158 before there was a sharp downside correction. The price dipped below the 23.6% Fib retracement level of the upward move from the $1,792 swing low to the $2,158 high.
Ethereum price is now trading above $2,000 and the 100-hourly Simple Moving Average. If the bulls remain in action above $2,000, the price could attempt another increase. Immediate resistance is seen near the $2,080 level.
The first key resistance is near the $2,120 level. The next major resistance is near the $2,150 level. A clear move above the $2,150 resistance might send the price toward the $2,200 resistance. An upside break above the $2,200 region might call for more gains in the coming days. In the stated case, Ether could rise toward the $2,250 resistance zone or even $2,320 in the near term.
Another Drop In ETH?If Ethereum fails to clear the $2,120 resistance, it could start a fresh decline. Initial support on the downside is near the $2,000 level. The first major support sits near the $1,975 zone or the 50% Fib retracement level of the upward move from the $1,792 swing low to the $2,158 high.
A clear move below the $1,975 support might push the price toward the $1,930 support. Any more losses might send the price toward the $1,900 region. The main support could be $1,880.
Technical Indicators
Hourly MACD – The MACD for ETH/USD is losing momentum in the bullish zone.
Hourly RSI – The RSI for ETH/USD is now above the 50 zone.
Major Support Level – $1,975
Major Resistance Level – $2,150
Original source
Read on NewsBTCRelated market context

Ethereum Nears 200 Million Non-Empty Wallets Despite Market Uncertainty
Despite persistent market uncertainty and bearish sentiment across parts of the cryptocurrency sector, Ethereum is approaching a s...

Ethereum Price Prediction: 3 Million ETH Rushes Into Staking as Sellers Vanish
Is nobody leaving Ethereum? A record 36 million ETH is now locked in staking, roughly 29–30% of the circulating supply, and the va...

Kraken Becomes Official Crypto Exchange Supporter Of FIFA World Cup 2026
TL;DR Kraken says it has become the Official Crypto Exchange Supporter of the FIFA World Cup 2026. The tournament expands to 48 te...

Most Traders Will Scroll Past This Grok AI Bitcoin Predicts, Big Mistake
Elon Musk Grok AI just looked at a Bitcoin chart down more than 50% and predicts it’s a classic accumulation zone, targeting $150,...

XRP Price Prediction: Japan Regulates Crypto like Stocks, XRP to Benefit First
Japan just rewrote the rules. XRP price is battling below resistance at $1.10, but it’s prediction is getting bullish as Japan’s p...

XRP Price Prediction: Japan XRP ETF Listing is Getting Closer
Japan just handed XRP bulls a major regulatory tailwind. XRP price is retesting a congestion zone, and the prediction could turn b...