Ethereum Price Rebounds to $2,500: Is There More Room to Climb?
Ethereum price started a recovery wave from the $1,910 zone. ETH is up over 10% and is now consolidating near the $2,500 zone. Ethereum started a recovery wave above the $2,250 and $2,400 levels. The price is trading bel...

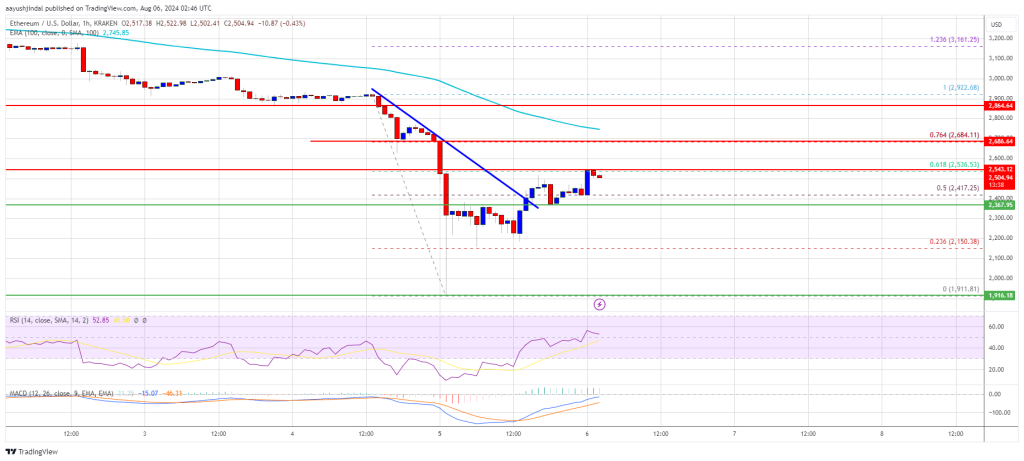
Ethereum price started a recovery wave from the $1,910 zone. ETH is up over 10% and is now consolidating near the $2,500 zone.
- Ethereum started a recovery wave above the $2,250 and $2,400 levels.
- The price is trading below $2,650 and the 100-hourly Simple Moving Average.
- There was a break above a key bearish trend line with resistance at $2,400 on the hourly chart of ETH/USD (data feed via Kraken).
- The pair could struggle to clear the $2,680 resistance zone.
Ethereum price gained bearish momentum below the $2,500 support. ETH dragged Bitcoin lower and traded below the $2,200 support. It even spiked below the $2,000 level before the bulls appeared.
A low was formed at $1,911 and the price recently started a recovery wave. There was a recovery wave above the $2,250 level. The price broke the 50% Fib retracement level of the downward move from the $2,920 swing high to the $1,910 swing low.
Besides, there was a break above a key bearish trend line with resistance at $2,400 on the hourly chart of ETH/USD. Ethereum price is still trading below $2,650 and the 100-hourly Simple Moving Average.
On the upside, the price is facing hurdles near the $2,550 level and the 61.8% Fib retracement level of the downward move from the $2,920 swing high to the $1,910 swing low. The first major resistance is near the $2,680 level.
The next major hurdle is near the $2,650 level. A close above the $2,650 level might send Ether toward the $2,850 resistance. The next key resistance is near $2,880. An upside break above the $2,880 resistance might send the price higher toward the $3,000 resistance zone in the near term.
Another Decline In ETH?If Ethereum fails to clear the $2,550 resistance, it could start another decline. Initial support on the downside is near $2,365. The first major support sits near the $2,250 zone.
A clear move below the $2,250 support might push the price toward $2,050. Any more losses might send the price toward the $2,000 support level in the near term. The next key support sits at $1,920.
Technical Indicators
Hourly MACD – The MACD for ETH/USD is gaining momentum in the bullish zone.
Hourly RSI – The RSI for ETH/USD is now above the 50 zone.
Major Support Level – $2,365
Major Resistance Level – $2,550
Original source
Read on NewsBTCRelated market context

Uranium Holds Above $85 as Mining ETF Rebounds From June Sell-Off
The latest charts display that the market is divided into stable physical prices and uranium shares trying to regain momentum afte...

Tether USDT Briefly Overtakes Ethereum in Market Cap: A $187B Wake-Up Call
For a few hours, earlier this week, Tether USDT stablecoin held a higher market cap than Ethereum, the first time that has happene...

Standard Chartered Says Bitcoin Bottomed Near $59,000 As Crypto Winter Ends
TL;DR Standard Chartered’s Geoffrey Kendrick reportedly says Bitcoin’s $59,000 area marked the cycle bottom. The note cites SpaceX...

Elon Musk’s trillionaire status puts his net worth above crypto’s entire market cap outside Bitcoin
Elon Musk has become the first person in modern history to amass a personal net worth exceeding $1 trillion, crossing the historic...

Crypto Today: Bitcoin ETF Rumours, Ethereum Strength, and Mining Heat for Canadian Homes
Bitcoin ETF rumours lift sentiment, Ethereum recaptures $3,800, and North Vancouver uses mining heat for homes. Coinbase unveils p...

Google Gemini AI Predicts Jaw-Dropping XRP Price For Next 90 Days
Google Gemini AI just put XRP back under the spotlight, predicting it is tightly wound for a major breakout toward $1.60 to $1.80...