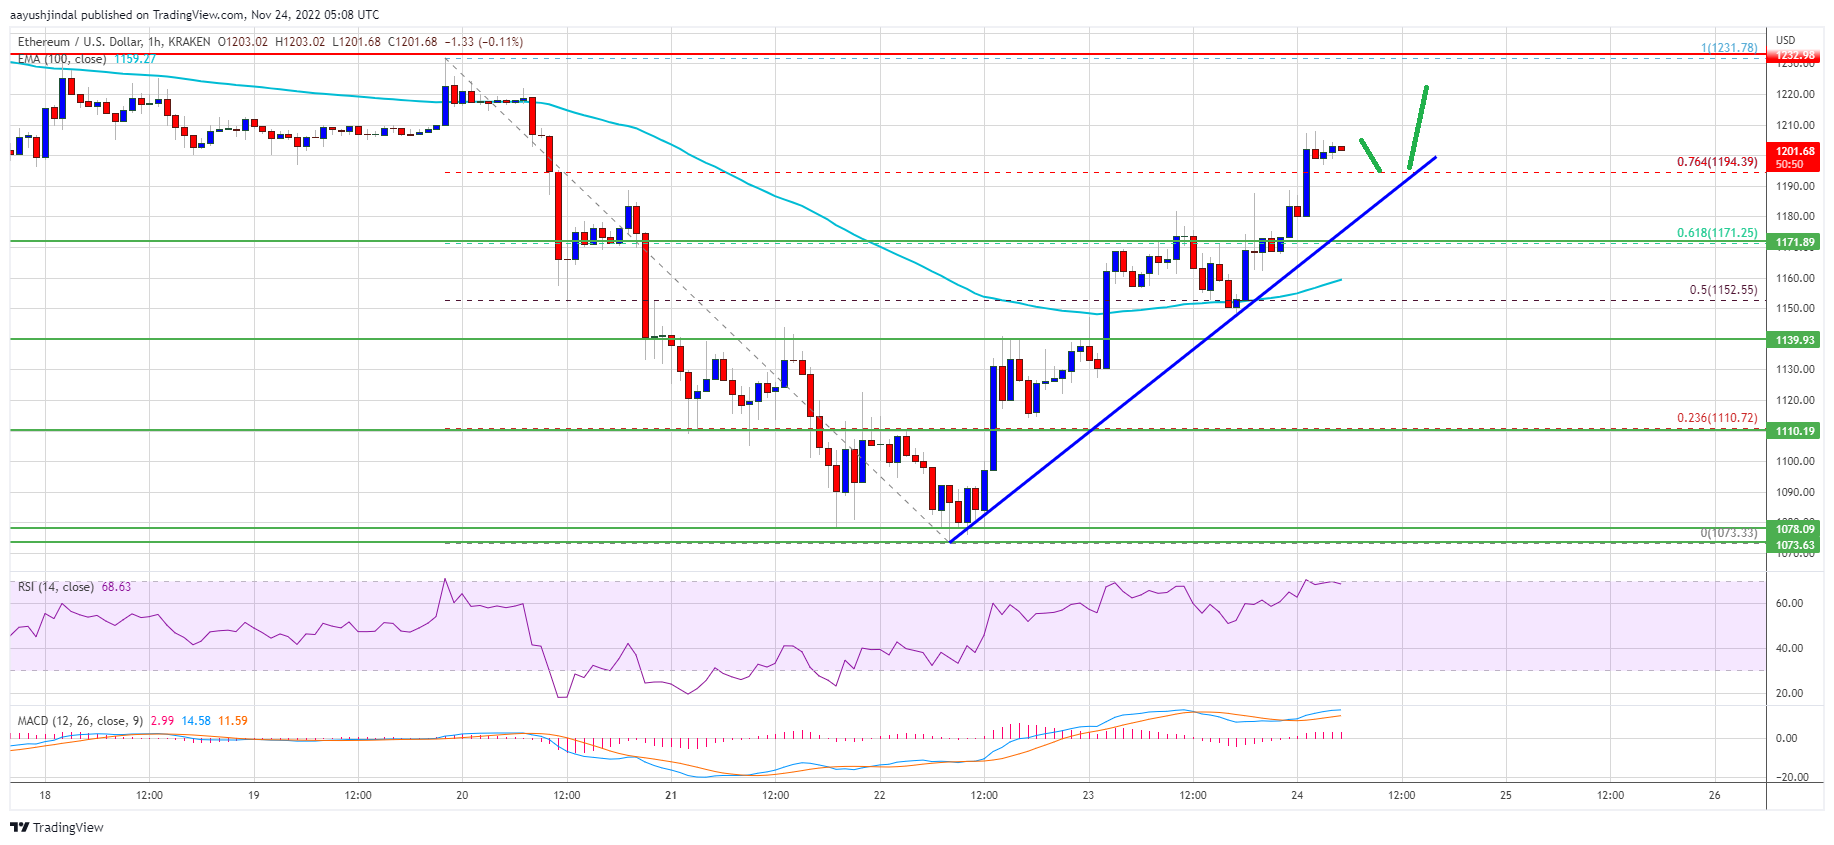
Ethereum Price Recovers But Bears Are Not Out Of The Woods Yet
Ethereum started a decent recovery wave above $1,150 against the US Dollar. ETH is now approaching a major hurdle near $1,230 and $1,250. Ethereum started an upside correction above the $1,120 and $1,150 resistance level...

Ethereum started a decent recovery wave above $1,150 against the US Dollar. ETH is now approaching a major hurdle near $1,230 and $1,250.
- Ethereum started an upside correction above the $1,120 and $1,150 resistance levels.
- The price is now trading above $1,150 and the 100 hourly simple moving average.
- There is a key bullish trend line forming with support near $1,190 on the hourly chart of ETH/USD (data feed via Kraken).
- The pair could rise further towards $1,230, but the bears might take a strong stand.
Ethereum price formed a base above the $1,070 level and started a recovery wave, similar to bitcoin. ETH slowly moved higher and was able to clear the $1,150 resistance zone.
The bulls pushed the price above the 61.8% Fib retracement level of the downward move from the $1,231 swing high to $1,073 low. Ether price is now trading above $1,150 and the 100 hourly simple moving average. There is also a key bullish trend line forming with support near $1,190 on the hourly chart of ETH/USD.
The pair seems to be consolidating above the 76.4% Fib retracement level of the downward move from the $1,231 swing high to $1,073 low. An immediate resistance on the upside is near the $1,220 level.
Source: ETHUSD on TradingView.com
The next major resistance is near the $1,230 level and the $1,250 zone. To start a real recovery wave and gain bullish momentum, the price must settle above $1,250. A clear close above the $1,250 resistance could send the price towards the $1,320 resistance zone. Any more gains might open the doors for a test of the $1,400 resistance zone.
Fresh Decline in ETH?If ethereum fails to climb above the $1,250 resistance, it could start another decline. An initial support on the downside is near the $1,190 level and the trend line.
The next major support is near the $1,150 level and the 100 hourly simple moving average, below which ether price may perhaps decline further. In the stated scenario, the price could decline towards the $1,100 support zone in the near term. Any more losses might call for a move towards the main $1,070 support.
Technical Indicators
Hourly MACD – The MACD for ETH/USD is now gaining momentum in the bullish zone.
Hourly RSI – The RSI for ETH/USD is now above the 50 level.
Major Support Level – $1,150
Major Resistance Level – $1,250
Original source
Read on NewsBTCRelated market context

Uranium Holds Above $85 as Mining ETF Rebounds From June Sell-Off
The latest charts display that the market is divided into stable physical prices and uranium shares trying to regain momentum afte...

Standard Chartered Says Bitcoin Bottomed Near $59,000 As Crypto Winter Ends
TL;DR Standard Chartered’s Geoffrey Kendrick reportedly says Bitcoin’s $59,000 area marked the cycle bottom. The note cites SpaceX...

Google Gemini AI Predicts Jaw-Dropping XRP Price For Next 90 Days
Google Gemini AI just put XRP back under the spotlight, predicting it is tightly wound for a major breakout toward $1.60 to $1.80...

Bitcoin rises above $64,000 after Pakistan prime minister says Iran peace deal is near
Bitcoin traded above $64,000 on Saturday, supported by its strongest ETF inflows in a month and growing optimism around geopolitic...

Elon Musk’s trillionaire status puts his net worth above crypto’s entire market cap outside Bitcoin
Elon Musk has become the first person in modern history to amass a personal net worth exceeding $1 trillion, crossing the historic...

BTC Momentum Turns Positive as Bitcoin Fights to Hold the $64,000 Zone
Bitcoin ( BTC) is trading at $64,549 per coin on June 14, 2026, at 8 a.m. Eastern time, holding above a critical demand zone while...