Ethereum Price Recovers, Why 100 SMA Is The Key To Fresh Increase
Ethereum price recovered from the $1,985 zone. ETH is showing positive signs and might rise further if it clears the $2,075 resistance. Ethereum is recovering higher from the $1,985 zone. The price is trading above $2,04...

Ethereum price recovered from the $1,985 zone. ETH is showing positive signs and might rise further if it clears the $2,075 resistance.
- Ethereum is recovering higher from the $1,985 zone.
- The price is trading above $2,040 and the 100-hourly Simple Moving Average.
- There was a break above a key bearish trend line with resistance near $2,040 on the hourly chart of ETH/USD (data feed via Kraken).
- The pair could gain bullish momentum if it stays above the 100-hourly Simple Moving Average.
Ethereum price spiked before the $2,000 support before the bulls appeared. ETH traded as low as $1,986 and recently started a recovery wave, like Bitcoin.
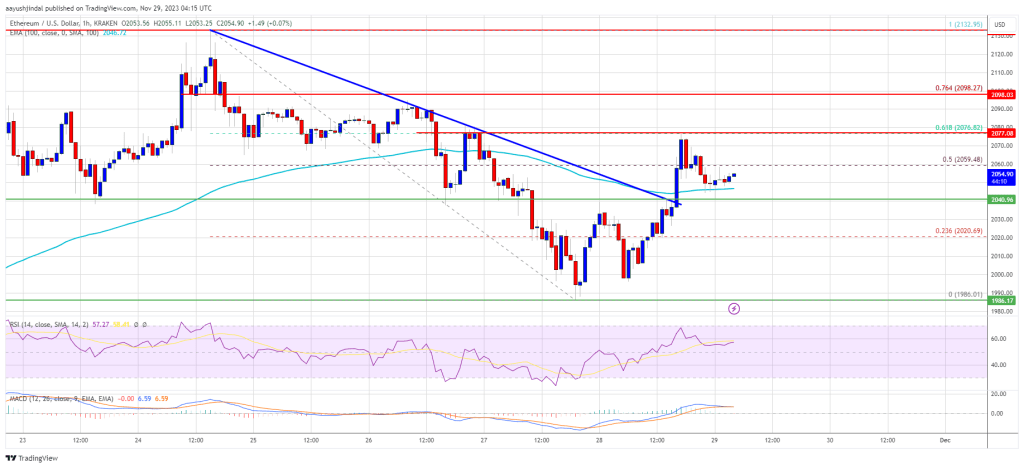
There was a decent increase above the $2,020 level. The price climbed above the 23.6% Fib retracement level of the downward move from the $2,132 swing high to the $1,986 low. Besides, there was a break above a key bearish trend line with resistance near $2,040 on the hourly chart of ETH/USD.
Ethereum is now trading above $2,040 and the 100-hourly Simple Moving Average. On the upside, the price is facing resistance near the $2,075 zone. It is close to the 61.8% Fib retracement level of the downward move from the $2,132 swing high to the $1,986 low.
The first key resistance is near the $2,100 level. The next resistance sits at $2,130. A clear move above the $2,130 level could send the price toward the $2,150 resistance zone.
Source: ETHUSD on TradingView.com
The next resistance is near $2,220, above which the price could aim for a move toward the $2,265 level. Any more gains could start a wave toward the $2,320 level.
Another Decline in ETH?If Ethereum fails to clear the $2,075 resistance, it could start a fresh decline. Initial support on the downside is near the $2,045 level and the 100-hourly Simple Moving Average, below which the bears might gain strength.
The next key support is $2,000. A downside break below $2,000 might spark a strong bearish move. The key support is now at $1,930, below which there is a risk of a move toward the $1,880 level in the near term.
Technical Indicators
Hourly MACD – The MACD for ETH/USD is losing momentum in the bullish zone.
Hourly RSI – The RSI for ETH/USD is now above the 50 level.
Major Support Level – $2,045
Major Resistance Level – $2,075
Original source
Read on NewsBTCRelated market context

Standard Chartered Says Bitcoin Bottomed Near $59,000 As Crypto Winter Ends
TL;DR Standard Chartered’s Geoffrey Kendrick reportedly says Bitcoin’s $59,000 area marked the cycle bottom. The note cites SpaceX...

Uranium Holds Above $85 as Mining ETF Rebounds From June Sell-Off
The latest charts display that the market is divided into stable physical prices and uranium shares trying to regain momentum afte...

Google Gemini AI Predicts Jaw-Dropping XRP Price For Next 90 Days
Google Gemini AI just put XRP back under the spotlight, predicting it is tightly wound for a major breakout toward $1.60 to $1.80...

Elon Musk SpaceX AI Predicts Incredible Bitcoin Price For Next 30 Days
Here is the thing about capitulation calls. They only sound smart in hindsight. Right now, with Bitcoin price scraping along the l...

Bitcoin rises above $64,000 after Pakistan prime minister says Iran peace deal is near
Bitcoin traded above $64,000 on Saturday, supported by its strongest ETF inflows in a month and growing optimism around geopolitic...

Fireblocks Says Institutional ETH Staking Is Moving Toward Standardized Rails
TL;DR Fireblocks says it has launched ETH Staking Link, a standardized interface for institutional Ethereum staking integrations....