Ethereum Price Recovery Could Soon Fade If ETH Fails To Surpass $1,250
Ethereum started a decent recovery wave above $1,180 against the US Dollar. ETH could start a fresh decline if it stays below the $1,250 resistance. Ethereum struggled to gain pace for a move above the $1,230 resistance...

Ethereum started a decent recovery wave above $1,180 against the US Dollar. ETH could start a fresh decline if it stays below the $1,250 resistance.
- Ethereum struggled to gain pace for a move above the $1,230 resistance level.
- The price is now trading above $1,170 and the 100 hourly simple moving average.
- There is a short-term bullish flag forming with resistance near $1,200 on the hourly chart of ETH/USD (data feed via Kraken).
- The pair could start a fresh decline if there is no clear move above $1,230 and $1,250.
Ethereum price started a recovery wave above the $1,150 resistance, similar to bitcoin. ETH even climbed above the $1,200 resistance and settled above the 100 hourly simple moving average.
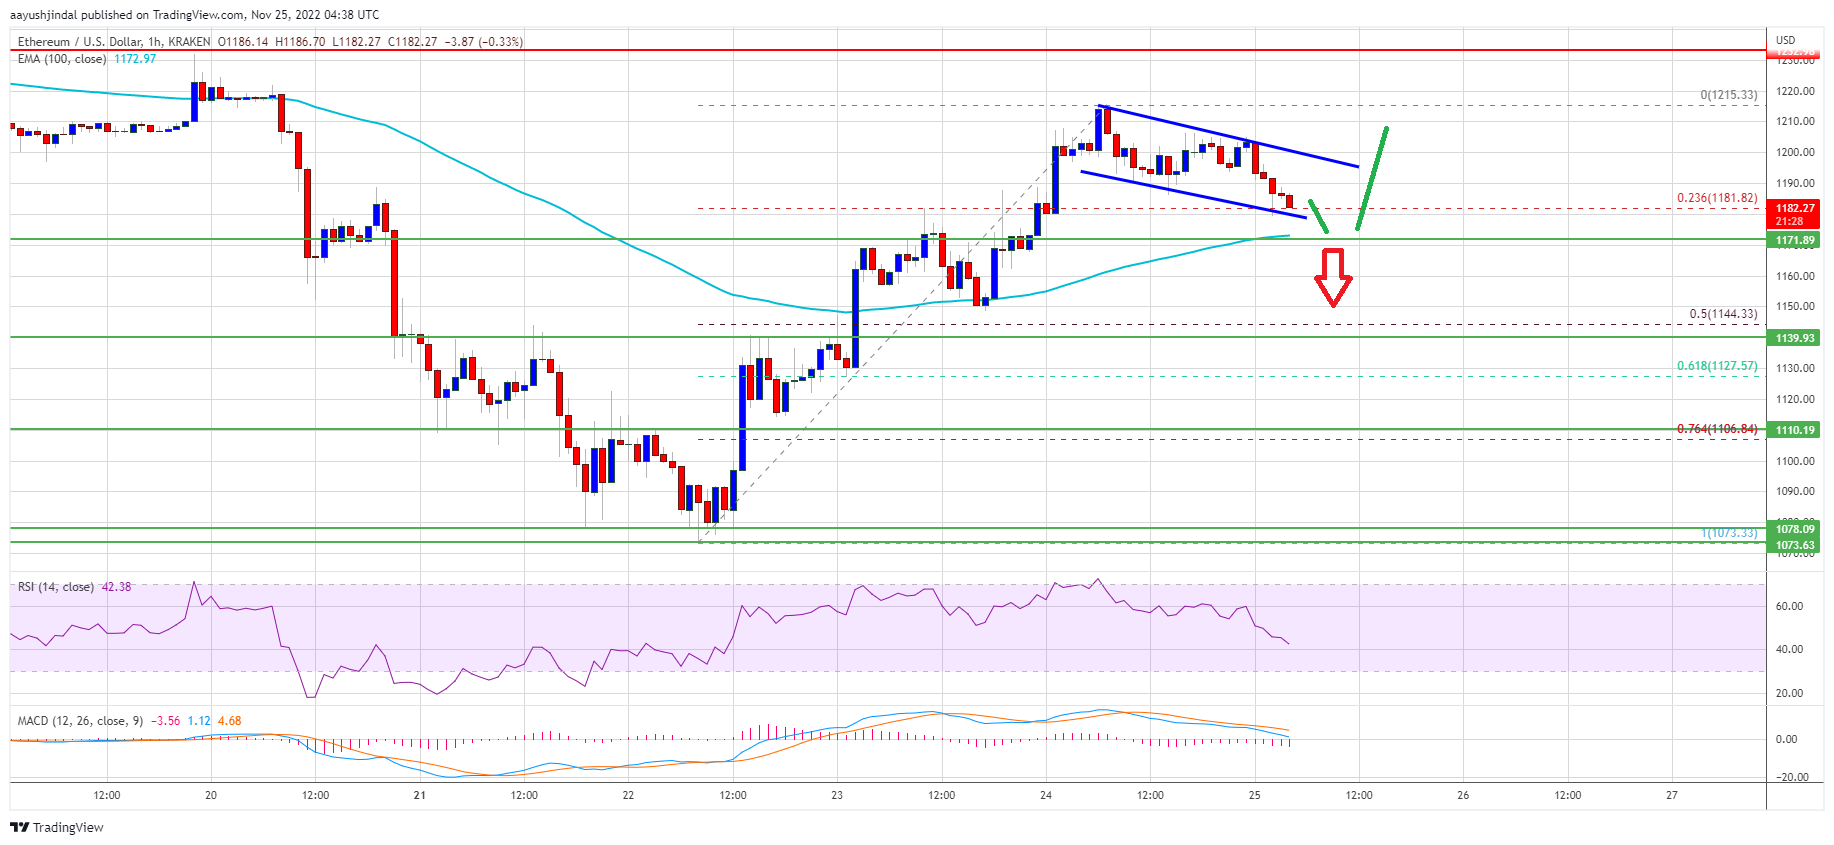
However, there was no test of the $1,230 resistance zone. Ether price traded as high as $1,215 and is currently correcting gains. There was a minor decline below the $1,200 level. It is now approaching the 23.6% Fib retracement level of the upward move from the $1,073 swing low to $1,215 high.
It is now trading above $1,170 and the 100 hourly simple moving average. There is also a short-term bullish flag forming with resistance near $1,200 on the hourly chart of ETH/USD. An immediate resistance on the upside is near the $1,200 level and the channel trend line.
Source: ETHUSD on TradingView.com
The next major resistance is near the $1,230 level. The key breakout zone sits near the $1,250 level. To move into a positive zone, the price must settle above $1,250. In the stated case, ether price may perhaps rise towards the $1,320 resistance zone. Any more gains might open the doors for a test of the $1,400 resistance zone.
Fresh Decline in ETH?If ethereum fails to climb above the $1,230 resistance, it could start another decline. An initial support on the downside is near the $1,170 level and the 100 hourly simple moving average.
The next major support is near the $1,150 level or the 50% Fib retracement level of the upward move from the $1,073 swing low to $1,215 high, below which ether price may perhaps gain bearish momentum. In the stated scenario, the price could decline towards the $1,070 support zone.
Technical Indicators
Hourly MACD – The MACD for ETH/USD is now gaining momentum in the bearish zone.
Hourly RSI – The RSI for ETH/USD is now below the 50 level.
Major Support Level – $1,150
Major Resistance Level – $1,230
Original source
Read on NewsBTCRelated market context

Uranium Holds Above $85 as Mining ETF Rebounds From June Sell-Off
The latest charts display that the market is divided into stable physical prices and uranium shares trying to regain momentum afte...

Tether USDT Briefly Overtakes Ethereum in Market Cap: A $187B Wake-Up Call
For a few hours, earlier this week, Tether USDT stablecoin held a higher market cap than Ethereum, the first time that has happene...

Standard Chartered Says Bitcoin Bottomed Near $59,000 As Crypto Winter Ends
TL;DR Standard Chartered’s Geoffrey Kendrick reportedly says Bitcoin’s $59,000 area marked the cycle bottom. The note cites SpaceX...

Elon Musk’s trillionaire status puts his net worth above crypto’s entire market cap outside Bitcoin
Elon Musk has become the first person in modern history to amass a personal net worth exceeding $1 trillion, crossing the historic...

XRP aims for $0.90 as ETF demand battles selling pressure from whales
XRP is trading at $1.11, down roughly 17% from its June opening, having set a new 2026 low on June 5 and shed $8 billion in market...

Crypto Today: Bitcoin ETF Rumours, Ethereum Strength, and Mining Heat for Canadian Homes
Bitcoin ETF rumours lift sentiment, Ethereum recaptures $3,800, and North Vancouver uses mining heat for homes. Coinbase unveils p...