Ethereum Price Recovery Could Soon Fade If ETH Fails To Surpass $1,400
Ethereum is slowly moving lower below $1,300 against the US Dollar. ETH remains at a risk of major decline if it stays below $1,400 for a long time. Ethereum started a fresh decline after it failed to clear the $1,350 re...

Ethereum is slowly moving lower below $1,300 against the US Dollar. ETH remains at a risk of major decline if it stays below $1,400 for a long time.
- Ethereum started a fresh decline after it failed to clear the $1,350 resistance.
- The price is now trading below $1,320 and the 100 hourly simple moving average.
- There was a break below a key bullish trend line with support near $1,320 on the hourly chart of ETH/USD (data feed via Kraken).
- The pair could gain bearish momentum if it breaks the $1,265 support zone.
Ethereum attempted a fresh increase above the $1,350 level, similar to bitcoin price. ETH struggled to gain pace for a move above the $1,350 level.
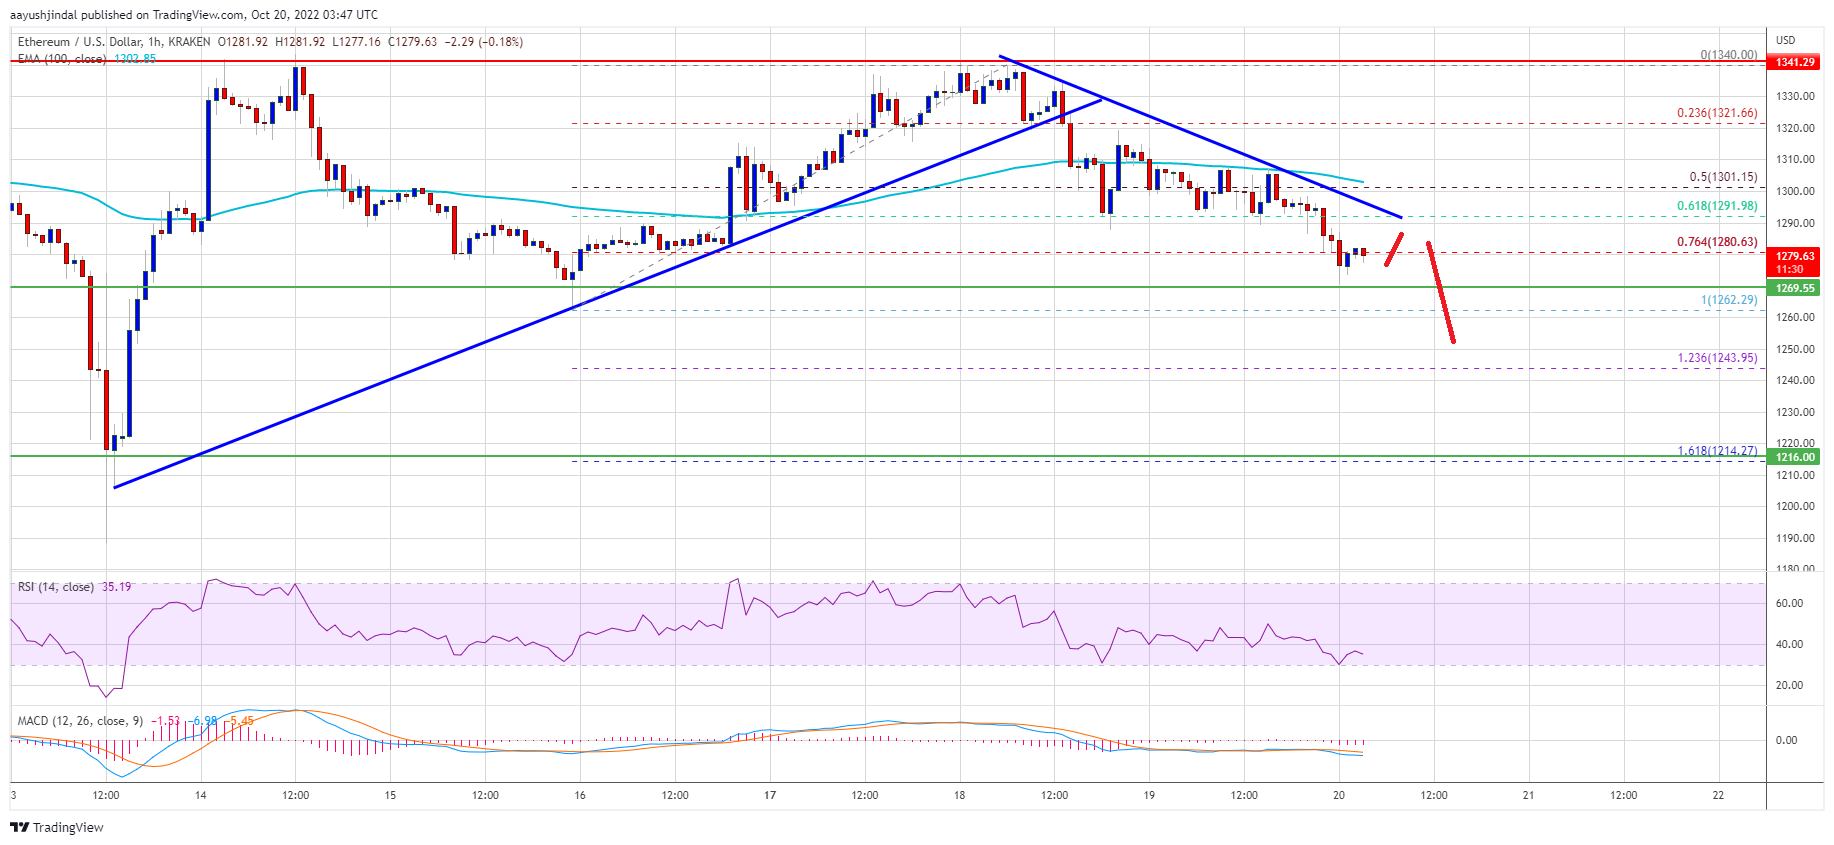
The price traded as high as $1,340 and started a fresh decline. There was a move below the $1,320 support zone. Besides, there was a break below a key bullish trend line with support near $1,320 on the hourly chart of ETH/USD. The pair even declined below the 50% Fib retracement level of the upward move from the $1,262 swing low to $1,340 high.
Ether price is now trading below $1,320 and the 100 hourly simple moving average. An immediate resistance on the upside is near the $1,290 level and a connecting bearish trend line on the same chart.
Source: ETHUSD on TradingView.com
The first major resistance is near the $1,300 level and the 100 hourly simple moving average. A clear upside break above the $1,300 resistance zone could open the doors for a move towards the $1,320 level. The main resistance is still near the $1,350 level, above which ether price might accelerate higher.
Downside Break in ETH?If ethereum fails to climb above the $1,300 resistance, it could continue to move down. An initial support on the downside is near the $1,265 level.
The next major support is near the $1,240 level or the 1.236 Fib extension level of the upward move from the $1,262 swing low to $1,340 high. A downside break below the $1,240 zone might start a fresh decline to $1,220. Any more losses may perhaps open the gates for a move towards the $1,200 support.
Technical Indicators
Hourly MACD – The MACD for ETH/USD is now gaining momentum in the bearish zone.
Hourly RSI – The RSI for ETH/USD is now below the 50 level.
Major Support Level – $1,265
Major Resistance Level – $1,300
Original source
Read on NewsBTCRelated market context

Bitcoin price challenges $64,000 weekend wall – needing a breakout or risk a deeper correction
Bitcoin reclaimed $64,000 on June 12 and touched an intraday high of $64,301 in the same session that spot ETF flows finally flipp...

Uranium Holds Above $85 as Mining ETF Rebounds From June Sell-Off
The latest charts display that the market is divided into stable physical prices and uranium shares trying to regain momentum afte...

Standard Chartered Says Bitcoin Bottomed Near $59,000 As Crypto Winter Ends
TL;DR Standard Chartered’s Geoffrey Kendrick reportedly says Bitcoin’s $59,000 area marked the cycle bottom. The note cites SpaceX...

Google Gemini AI Predicts Jaw-Dropping XRP Price For Next 90 Days
Google Gemini AI just put XRP back under the spotlight, predicting it is tightly wound for a major breakout toward $1.60 to $1.80...

Elon Musk’s trillionaire status puts his net worth above crypto’s entire market cap outside Bitcoin
Elon Musk has become the first person in modern history to amass a personal net worth exceeding $1 trillion, crossing the historic...

Elon Musk SpaceX AI Predicts Incredible Bitcoin Price For Next 30 Days
Here is the thing about capitulation calls. They only sound smart in hindsight. Right now, with Bitcoin price scraping along the l...