Ethereum Price Recovery In Trouble? Here Are Key Hurdles To Fresh Increase
Ethereum price declined sharply alongside Bitcoin. ETH traded below $2,000, but it is still holding the key support at $1,920 and might attempt a fresh increase. Ethereum struggled to clear the $2,070 resistance and corr...

Ethereum price declined sharply alongside Bitcoin. ETH traded below $2,000, but it is still holding the key support at $1,920 and might attempt a fresh increase.
- Ethereum struggled to clear the $2,070 resistance and corrected lower.
- The price is trading below $2,000 and the 100-hourly Simple Moving Average.
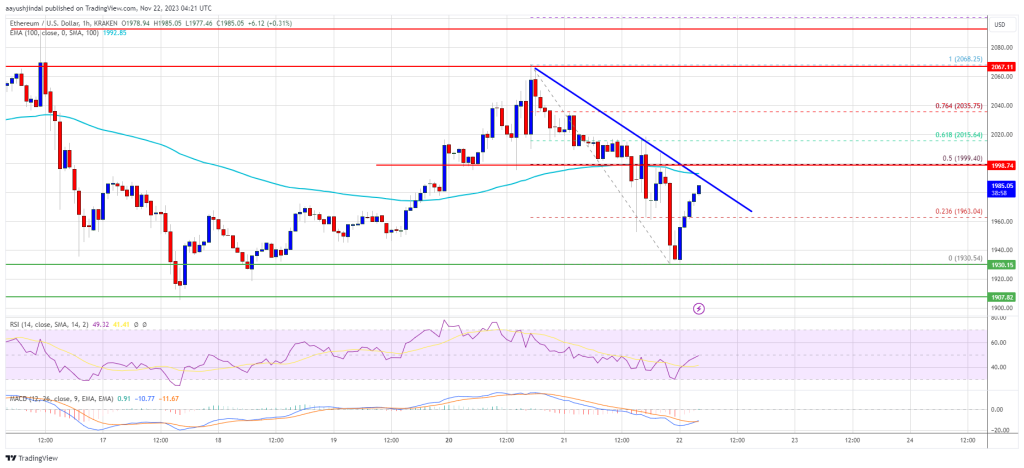
- There is a key bearish trend line forming with resistance near $1,990 on the hourly chart of ETH/USD (data feed via Kraken).
- The pair could start a fresh increase if it clears the $2,000 hurdle.
Ethereum price failed to clear the $2,070 resistance and reacted to the downside. ETH declined below the $2,000 support zone after reports of Binance’s settlement, like Bitcoin.
The bears even pushed the price below the $1,950 support zone and the 100-hourly Simple Moving Average. However, Ether stayed above the $1,920 support zone. A low was formed near $1,930 and the price is now attempting a fresh increase.
Ethereum broke the 23.6% Fib retracement level of the recent decline from the $2,068 swing high to the $1,930 level. However, it is still below $2,000 and the 100-hourly Simple Moving Average.
On the upside, the price is facing resistance near the $1,990 zone. There is also a key bearish trend line forming with resistance near $1,990 on the hourly chart of ETH/USD. The first key resistance is near the $2,000 level or the 50% Fib retracement level of the recent decline from the $2,068 swing high to the $1,930 level.
Source: ETHUSD on TradingView.com
A clear move above the $2,000 level could spark bullish moves. The next resistance is near $2,070, above which the price could aim for a move toward the $2,120 level. Any more gains could start a wave toward the $2,200 level.
More Losses in ETH?If Ethereum fails to clear the $2,000 resistance, it could start a fresh decline. Initial support on the downside is near the $1,950 level.
The next key support is $1,930 or $1,920. The main support is still near $1,905. A downside break below the $1,905 support might trigger more losses. In the stated case, Ether could drop toward the $1,820 support zone in the near term.
Technical Indicators
Hourly MACD – The MACD for ETH/USD is losing momentum in the bearish zone.
Hourly RSI – The RSI for ETH/USD is now near the 50 level.
Major Support Level – $1,930
Major Resistance Level – $2,000
Original source
Read on NewsBTCRelated market context

Bitcoin price challenges $64,000 weekend wall – needing a breakout or risk a deeper correction
Bitcoin reclaimed $64,000 on June 12 and touched an intraday high of $64,301 in the same session that spot ETF flows finally flipp...

Uranium Holds Above $85 as Mining ETF Rebounds From June Sell-Off
The latest charts display that the market is divided into stable physical prices and uranium shares trying to regain momentum afte...

Standard Chartered Says Bitcoin Bottomed Near $59,000 As Crypto Winter Ends
TL;DR Standard Chartered’s Geoffrey Kendrick reportedly says Bitcoin’s $59,000 area marked the cycle bottom. The note cites SpaceX...

US forces shoot down Iranian attack drones near Strait of Hormuz, Bitcoin drops below $73K
Geopolitical tensions near vital oil routes can destabilize financial markets, highlighting the interconnectedness of global secur...

Bitcoin Mining Cost Model Points To $47,000 Floor, But Analysts Urge Caution
TL;DR Crypto Rover says Bitcoin has never bottomed below electrical production cost, currently estimated at $47,000. Mining-cost m...

Are 24/7 CME Bitcoin futures a volatility cure — or a new leverage trap?
Wall Street got to trade Bitcoin around the clock just in time to watch the market fall apart. CME Group launched 24/7 trading for...