Ethereum Price Recovery May Stall Near 100-SMA: Is a Drop Coming?
Ethereum price is attempting a recovery wave above $2,280. ETH must clear the $2,360 resistance to continue higher in the near term. Ethereum is attempting a recovery wave from the $2,150 zone. The price is trading below...

Ethereum price is attempting a recovery wave above $2,280. ETH must clear the $2,360 resistance to continue higher in the near term.
- Ethereum is attempting a recovery wave from the $2,150 zone.
- The price is trading below $2,320 and the 100-hourly Simple Moving Average.
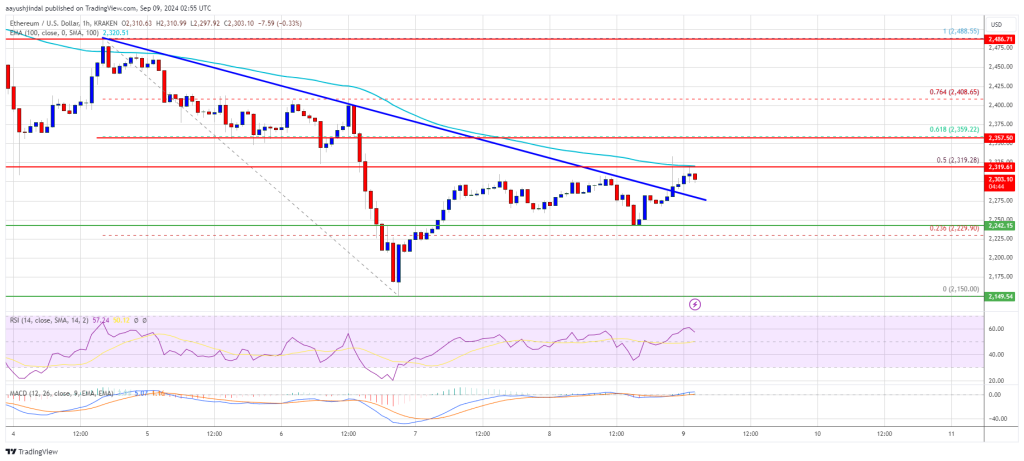
- There was a break above a key bearish trend line with resistance at $2,280 on the hourly chart of ETH/USD (data feed via Kraken).
- The pair must clear the $2,360 resistance to continue higher in the near term.
Ethereum price attempted a recovery wave above the $2,400 level. However, ETH failed to clear the $2,450 resistance zone. There was a fresh decline below $2,320 like Bitcoin.
It tested the $2,150 support zone. A low was formed at $2,150 and the price is now attempting a recovery wave. There was a move above the $2,220 and $2,280 resistance levels. The price climbed above the 23.6% Fib retracement level of the downward wave from the $2,488 swing high to the $2,150 low.
There was a break above a key bearish trend line with resistance at $2,280 on the hourly chart of ETH/USD. Ethereum price is now trading below $2,320 and the 100-hourly Simple Moving Average.
On the upside, the price seems to be facing hurdles near the $2,320 level. The first major resistance is near the $2,360 level or the 61.8% Fib retracement level of the downward wave from the $2,488 swing high to the $2,150 low. A close above the $2,360 level might send Ether toward the $2,420 resistance.
The next key resistance is near $2,480. An upside break above the $2,480 resistance might send the price higher toward the $2,550 resistance zone in the near term.
Another Decline In ETH?If Ethereum fails to clear the $2,360 resistance, it could start another decline. Initial support on the downside is near $2,250. The first major support sits near the $2,180 zone.
A clear move below the $2,180 support might push the price toward $2,150. Any more losses might send the price toward the $2,050 support level in the near term. The next key support sits at $2,000.
Technical Indicators
Hourly MACD – The MACD for ETH/USD is losing momentum in the bearish zone.
Hourly RSI – The RSI for ETH/USD is now above the 50 zone.
Major Support Level – $2,180
Major Resistance Level – $2,360
Original source
Read on NewsBTCRelated market context

Uranium Holds Above $85 as Mining ETF Rebounds From June Sell-Off
The latest charts display that the market is divided into stable physical prices and uranium shares trying to regain momentum afte...

Standard Chartered Says Bitcoin Bottomed Near $59,000 As Crypto Winter Ends
TL;DR Standard Chartered’s Geoffrey Kendrick reportedly says Bitcoin’s $59,000 area marked the cycle bottom. The note cites SpaceX...

Tether USDT Briefly Overtakes Ethereum in Market Cap: A $187B Wake-Up Call
For a few hours, earlier this week, Tether USDT stablecoin held a higher market cap than Ethereum, the first time that has happene...

Google Gemini AI Predicts Jaw-Dropping XRP Price For Next 90 Days
Google Gemini AI just put XRP back under the spotlight, predicting it is tightly wound for a major breakout toward $1.60 to $1.80...

Bitcoin price challenges $64,000 weekend wall – needing a breakout or risk a deeper correction
Bitcoin reclaimed $64,000 on June 12 and touched an intraday high of $64,301 in the same session that spot ETF flows finally flipp...

North Korea declares denuclearization irreversibly terminated, raising stakes for crypto security
North Korea's stance heightens geopolitical tensions and underscores the urgent need for enhanced cybersecurity measures in the cr...