Ethereum Price Remains Vulnerable, Will ETH Fall Back To $1K?
Ethereum failed to clear the $1,300 resistance zone against the US Dollar. ETH is declining and there is a risk of a drop below the $1,265 support. Ethereum is still showing bearish signs below the $1,350 and $1,320 supp...

Ethereum failed to clear the $1,300 resistance zone against the US Dollar. ETH is declining and there is a risk of a drop below the $1,265 support.
- Ethereum is still showing bearish signs below the $1,350 and $1,320 support levels.
- The price is now trading below $1,300 and the 100 hourly simple moving average.
- There was a break below a key rising channel with support at $1,290 on the hourly chart of ETH/USD (data feed via Kraken).
- The pair remains at a risk of more losses unless there is a clear move above the $1,300 level.
Ethereum started a minor upside correction from the $1,265 support zone. ETH traded as low as $1,268 and recovered above the $1,280 level.
There was a break above the 23.6% Fib retracement level of the downward move from the $1,338 swing high to $1,268 low. Ether price even attempted a clear move above the $1,300 resistance zone and the 100 hourly simple moving average.
However, the bulls failed to gain strength for a close above $1,300. Ethereum price failed to clear the 50% Fib retracement level of the downward move from the $1,338 swing high to $1,268 low.
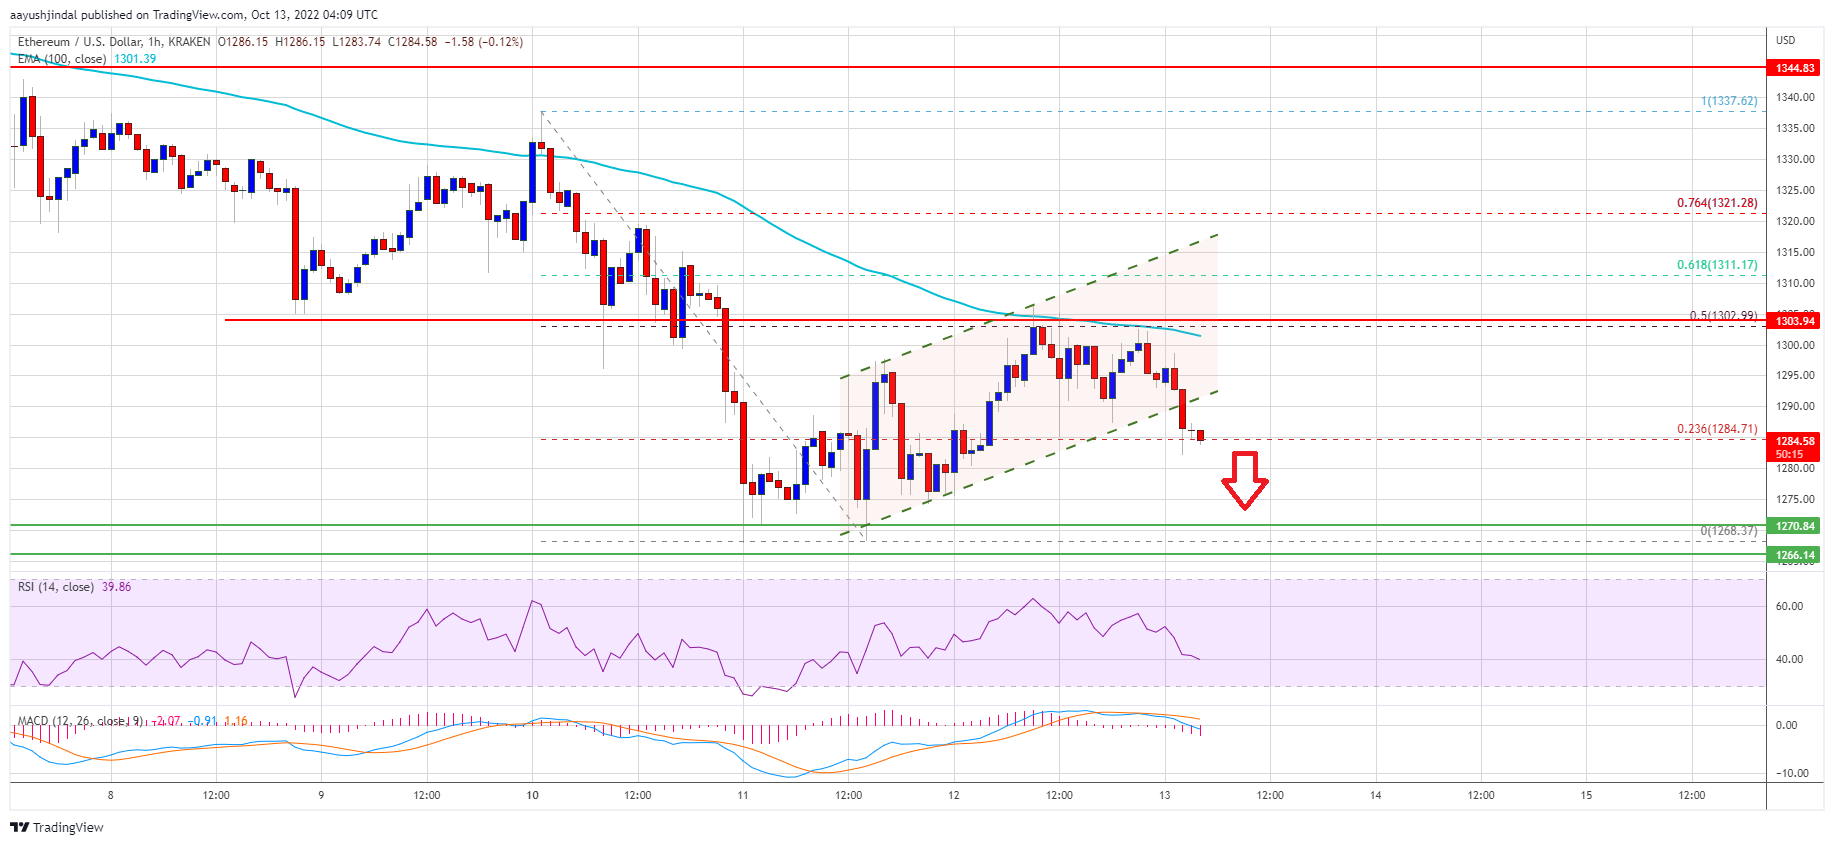
There was a fresh decline from $1,300. Besides, there was a break below a key rising channel with support at $1,290 on the hourly chart of ETH/USD. The pair is now trading below $1,300 and the 100 hourly simple moving average.
Source: ETHUSD on TradingView.com
An immediate resistance on the upside is near the $1,298 level. The first major resistance is near the $1,300 level. A clear upside break above the $1,300 resistance zone could open the doors for a steady increase. In the stated case, the price may perhaps rise towards the $1,350 resistance. Moreover, it could help bitcoin and other altcoins in gaining pace.
Sharp Drop in ETH?If ethereum fails to recover above the $1,300 resistance, it could continue to move down. An initial support on the downside is near the $1,275 level.
The next major support is near the $1,265 level. A downside break below the $1,265 might start a major decline towards $1,200. Any more losses may perhaps open the gates for a move towards the $1,000 support.
Technical Indicators
Hourly MACD – The MACD for ETH/USD is now gaining momentum in the bearish zone.
Hourly RSI – The RSI for ETH/USD is now below to the 50 level.
Major Support Level – $1,265
Major Resistance Level – $1,300
Original source
Read on NewsBTCRelated market context

Bitcoin price challenges $64,000 weekend wall – needing a breakout or risk a deeper correction
Bitcoin reclaimed $64,000 on June 12 and touched an intraday high of $64,301 in the same session that spot ETF flows finally flipp...

Uranium Holds Above $85 as Mining ETF Rebounds From June Sell-Off
The latest charts display that the market is divided into stable physical prices and uranium shares trying to regain momentum afte...

Tether USDT Briefly Overtakes Ethereum in Market Cap: A $187B Wake-Up Call
For a few hours, earlier this week, Tether USDT stablecoin held a higher market cap than Ethereum, the first time that has happene...

Google Gemini AI Predicts Jaw-Dropping XRP Price For Next 90 Days
Google Gemini AI just put XRP back under the spotlight, predicting it is tightly wound for a major breakout toward $1.60 to $1.80...

Blackrock’s IBIT Leads $86 Million Bitcoin ETF Inflow as Ethereum Funds Extend Outflow Streak
Spot bitcoin exchange-traded funds (ETFs) drew $85.85 million in net inflows on Friday, with every one of the 12 tracked funds avo...

Crypto Today: Bitcoin ETF Rumours, Ethereum Strength, and Mining Heat for Canadian Homes
Bitcoin ETF rumours lift sentiment, Ethereum recaptures $3,800, and North Vancouver uses mining heat for homes. Coinbase unveils p...