Ethereum Price Restarts Increase But Can Bulls Turn It Into Rally?
Ethereum price is recovering losses from the $2,120 support. ETH is up over 3% and the price could gain pace if it clears the $2,250 resistance. Ethereum is moving higher from the $2,120 support zone. The price is tradin...

Ethereum price is recovering losses from the $2,120 support. ETH is up over 3% and the price could gain pace if it clears the $2,250 resistance.
- Ethereum is moving higher from the $2,120 support zone.
- The price is trading above $2,200 and the 100-hourly Simple Moving Average.
- There was a break above a key bearish trend line with resistance near $2,210 on the hourly chart of ETH/USD (data feed via Kraken).
- The pair could climb further higher if it clears the $2,250 resistance zone.
Ethereum price extended its decline below the $2,150 level. ETH remained strong above the $2,120 level. A low was formed near $2,116 and the price started a fresh increase, like Bitcoin.
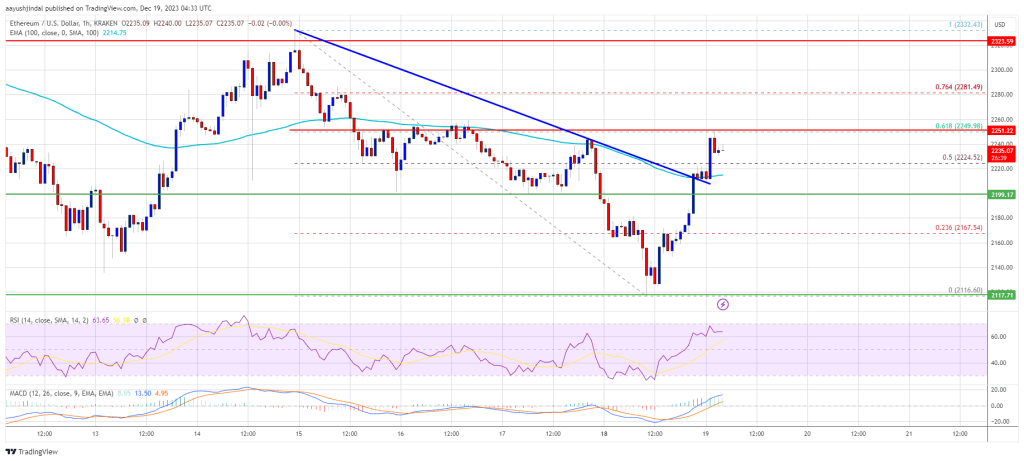
There was a move above the $2,150 and $2,200 resistance levels. The price climbed above the 50% Fib retracement level of the downward move from the $2,332 swing high to the $2,116 low. There was also a break above a key bearish trend line with resistance near $2,210 on the hourly chart of ETH/USD.
Ethereum is now trading above $2,200 and the 100-hourly Simple Moving Average. On the upside, the price is facing resistance near the $2,250 level. It is close to the 61.8% Fib retracement level of the downward move from the $2,332 swing high to the $2,116 low.
Source: ETHUSD on TradingView.com
The next key resistance is near the $2,280 level. A clear move above the $2,280 zone could send the price toward the $2,330 level. The next resistance sits at $2,400. Any more gains could start a wave toward the $2,550 level, above which Ethereum might rally and test the $2,750 zone.
Another Decline in ETH?If Ethereum fails to clear the $2,250 resistance, it could start another decline. Initial support on the downside is near the $2,210 level or the 100 hourly SMA.
The first key support could be the $2,200 zone. A downside break and a close below $2,200 might start another major decline. In the stated case, Ether could revisit the $2,120 support. Any more losses might send the price toward the $2,000 level in the coming days.
Technical Indicators
Hourly MACD – The MACD for ETH/USD is gaining momentum in the bullish zone.
Hourly RSI – The RSI for ETH/USD is now above the 50 level.
Major Support Level – $2,200
Major Resistance Level – $2,250
Original source
Read on NewsBTCRelated market context

Uranium Holds Above $85 as Mining ETF Rebounds From June Sell-Off
The latest charts display that the market is divided into stable physical prices and uranium shares trying to regain momentum afte...

Standard Chartered Says Bitcoin Bottomed Near $59,000 As Crypto Winter Ends
TL;DR Standard Chartered’s Geoffrey Kendrick reportedly says Bitcoin’s $59,000 area marked the cycle bottom. The note cites SpaceX...

Bitcoin rises above $64,000 after Pakistan prime minister says Iran peace deal is near
Bitcoin traded above $64,000 on Saturday, supported by its strongest ETF inflows in a month and growing optimism around geopolitic...

Bitcoin price faces new risk as big buyers lose conviction
Bitcoin’s largest buyers are no longer behaving like a reliable backstop for the largest cryptocurrency. The exchange-traded funds...

Tether USDT Briefly Overtakes Ethereum in Market Cap: A $187B Wake-Up Call
For a few hours, earlier this week, Tether USDT stablecoin held a higher market cap than Ethereum, the first time that has happene...

Google Gemini AI Predicts Jaw-Dropping XRP Price For Next 90 Days
Google Gemini AI just put XRP back under the spotlight, predicting it is tightly wound for a major breakout toward $1.60 to $1.80...