Ethereum Price Seeks Additional Gains as Bulls Try to Regain Momentum
Ethereum price started a recovery wave above $2,950. ETH is now consolidating and might soon attempt another recovery wave if it clears $3,050. Ethereum started a decent upward move above the $2,950 zone. The price is tr...

Ethereum price started a recovery wave above $2,950. ETH is now consolidating and might soon attempt another recovery wave if it clears $3,050.
- Ethereum started a decent upward move above the $2,950 zone.
- The price is trading above $2,950 and the 100-hourly Simple Moving Average.
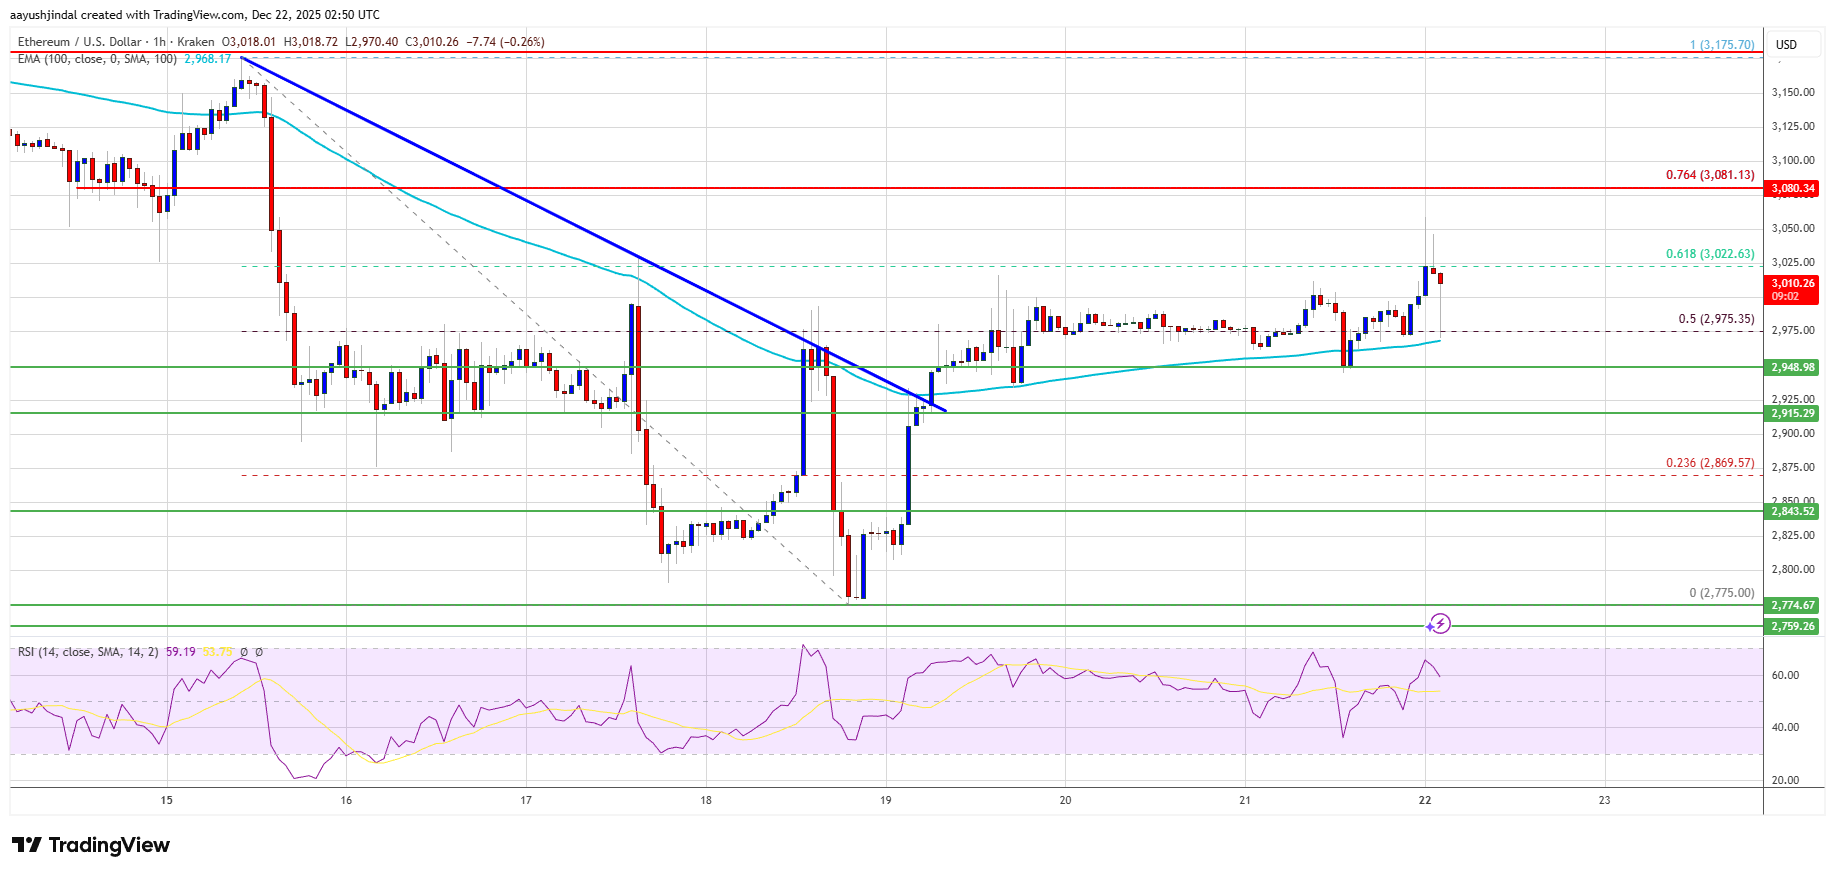
- There was a break above a bearish trend line with resistance at $2,920 on the hourly chart of ETH/USD (data feed via Kraken).
- The pair could continue to move up if it settles above the $3,050 zone.
Ethereum price started a decent increase from $2,775, like Bitcoin. ETH price was able to surpass the $2,850 and $2,880 resistance levels to enter a positive zone.
The bulls pushed the price above the 50% Fib retracement level of the downward move from the $3,175 swing high to the $2,775 low. Moreover, there was a break above a bearish trend line with resistance at $2,920 on the hourly chart of ETH/USD.
Ethereum price is now trading above $2,950 and the 100-hourly Simple Moving Average. If there is another upward move, the price could face resistance near the $3,020 level and the 61.8% Fib retracement level of the downward move from the $3,175 swing high to the $2,775 low.
The next key resistance is near the $3,050 level. The first major resistance is near the $3,080 level. A clear move above the $3,080 resistance might send the price toward the $3,150 resistance. An upside break above the $3,150 region might call for more gains in the coming days. In the stated case, Ether could rise toward the $3,220 resistance zone or even $3,250 in the near term.
Another Decline In ETH?If Ethereum fails to clear the $3,050 resistance, it could start a fresh decline. Initial support on the downside is near the $2,950 level. The first major support sits near the $2,915 zone.
A clear move below the $2,915 support might push the price toward the $2,880 support. Any more losses might send the price toward the $2,840 region. The next key support sits at $2,800.
Technical Indicators
Hourly MACD – The MACD for ETH/USD is losing momentum in the bullish zone.
Hourly RSI – The RSI for ETH/USD is now above the 50 zone.
Major Support Level – $2,915
Major Resistance Level – $3,050
Original source
Read on NewsBTCRelated market context

Ethereum Price Prediction: 3 Million ETH Rushes Into Staking as Sellers Vanish
Is nobody leaving Ethereum? A record 36 million ETH is now locked in staking, roughly 29–30% of the circulating supply, and the va...

Most Traders Will Scroll Past This Grok AI Bitcoin Predicts, Big Mistake
Elon Musk Grok AI just looked at a Bitcoin chart down more than 50% and predicts it’s a classic accumulation zone, targeting $150,...

XRP Price Prediction: Japan Regulates Crypto like Stocks, XRP to Benefit First
Japan just rewrote the rules. XRP price is battling below resistance at $1.10, but it’s prediction is getting bullish as Japan’s p...

XRP Price Prediction: Japan XRP ETF Listing is Getting Closer
Japan just handed XRP bulls a major regulatory tailwind. XRP price is retesting a congestion zone, and the prediction could turn b...

The 3-Part Impulse That Shows Where The XRP Price Is Headed Next
XRP bulls are trying to turn a brutal selloff into something bigger than a relief bounce. An interesting setup shows a possible th...

Kraken Adds USDCx Support On Canton As Institutional Stablecoin Rails Expand
TL;DR Kraken says it now supports USDCx deposits and withdrawals on the Canton Network. USDCx is described as a Canton-native stab...