Ethereum Price Sees Technical Correction But Key Uptrend Support Intact
Ethereum price rallied following Bitcoin and tested $1,850 against the US dollar. ETH is correcting gains, but the bulls might remain active near $1,750. Ethereum started a downside correction from the $1,850 resistance....

Ethereum price rallied following Bitcoin and tested $1,850 against the US dollar. ETH is correcting gains, but the bulls might remain active near $1,750.
- Ethereum started a downside correction from the $1,850 resistance.
- The price is trading above $1,750 and the 100-hourly Simple Moving Average.
- There is a major bullish trend line forming with support near $1,755 on the hourly chart of ETH/USD (data feed via Kraken).
- The pair could start a fresh increase unless there is a clear move below $1,750.
Ethereum started a strong increase above the $1,750 resistance. Bitcoin dragged ETH higher toward the $1,850 resistance before the bears appeared.
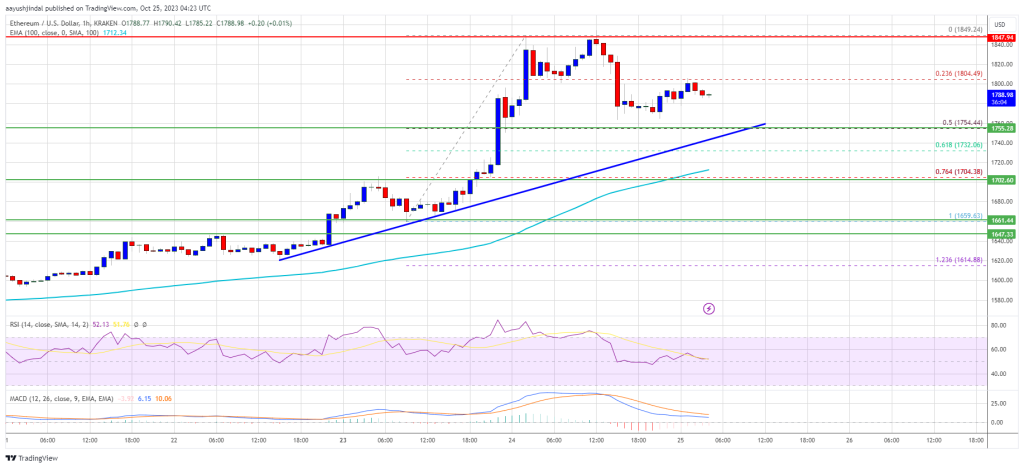
A high is formed near $1,849 and the price is now correcting gains. It traded below the 23.6% Fib retracement level of the upward move from the $1,659 swing low to the $1,849 high. However, the price is still trading in a positive zone.
Ethereum is now trading above $1,750 and the 100-hourly Simple Moving Average. There is also a major bullish trend line forming with support near $1,755 on the hourly chart of ETH/USD. The trend line is near the 50% Fib retracement level of the upward move from the $1,659 swing low to the $1,849 high.
Source: ETHUSD on TradingView.com
On the upside, the price is facing resistance near the $1,805 level. The first major resistance is near the $1,850 zone. The next key resistance is near $1,880. A close above the $1,880 resistance could send the price further higher. The next key resistance is $1,950, above which the price could accelerate higher. In the stated case, Ether could test the main $2,000 barrier. Any more gains might open the doors for a move toward $2,200.
More Losses in ETH?If Ethereum fails to clear the $1,805 resistance, it could continue to move down. Initial support on the downside is near the $1,780 level.
The next key support is $1,750 and the trend line zone. A downside break below the $1,750 support might send the price further lower. In the stated case, Ether could drop toward the $1,720 level. Any more losses may perhaps send Ether toward the $1,700 level and the 100-hourly Simple Moving Average.
Technical Indicators
Hourly MACD – The MACD for ETH/USD is losing momentum in the bullish zone.
Hourly RSI – The RSI for ETH/USD is now above the 50 level.
Major Support Level – $1,750
Major Resistance Level – $1,805
Original source
Read on NewsBTCRelated market context

Uranium Holds Above $85 as Mining ETF Rebounds From June Sell-Off
The latest charts display that the market is divided into stable physical prices and uranium shares trying to regain momentum afte...

Tether USDT Briefly Overtakes Ethereum in Market Cap: A $187B Wake-Up Call
For a few hours, earlier this week, Tether USDT stablecoin held a higher market cap than Ethereum, the first time that has happene...

Google Gemini AI Predicts Jaw-Dropping XRP Price For Next 90 Days
Google Gemini AI just put XRP back under the spotlight, predicting it is tightly wound for a major breakout toward $1.60 to $1.80...

Standard Chartered Says Bitcoin Bottomed Near $59,000 As Crypto Winter Ends
TL;DR Standard Chartered’s Geoffrey Kendrick reportedly says Bitcoin’s $59,000 area marked the cycle bottom. The note cites SpaceX...

Bitcoin price challenges $64,000 weekend wall – needing a breakout or risk a deeper correction
Bitcoin reclaimed $64,000 on June 12 and touched an intraday high of $64,301 in the same session that spot ETF flows finally flipp...

Elon Musk SpaceX AI Predicts Incredible Bitcoin Price For Next 30 Days
Here is the thing about capitulation calls. They only sound smart in hindsight. Right now, with Bitcoin price scraping along the l...