Ethereum Price Shows Weakness: Can It Overcome The Struggles?
Ethereum price failed to continue higher above the $2,550 resistance zone. ETH is now consolidating near $2,450 and showing a few bearish signs. Ethereum started a recovery wave above the $2,400 and $2,420 levels. The pr...

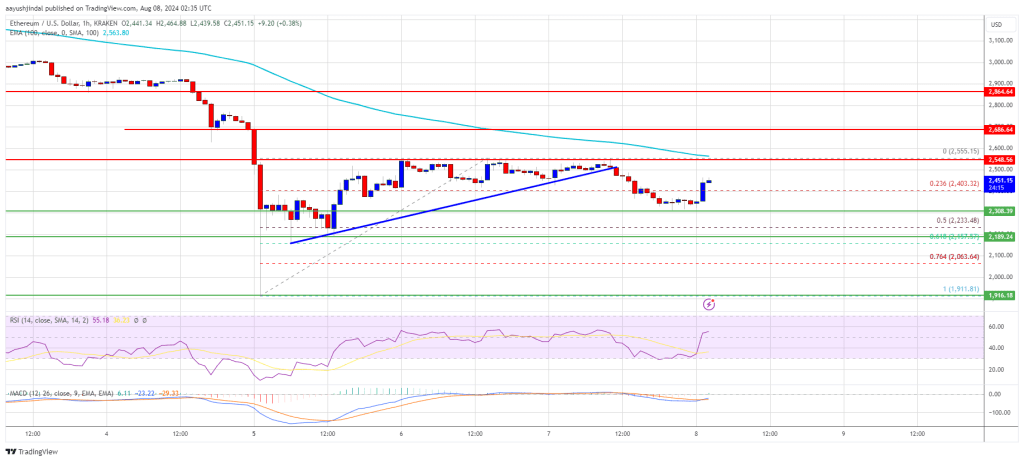
Ethereum price failed to continue higher above the $2,550 resistance zone. ETH is now consolidating near $2,450 and showing a few bearish signs.
- Ethereum started a recovery wave above the $2,400 and $2,420 levels.
- The price is trading below $2,550 and the 100-hourly Simple Moving Average.
- There was a break below a connecting bullish trend line with support at $2,500 on the hourly chart of ETH/USD (data feed via Kraken).
- The pair could rise steadily if it clears the $2,550 resistance zone.
Ethereum price started a recovery wave above the $2,250 resistance level. ETH climbed above the $2,320 and $2,450 resistance levels like Bitcoin above $65,000.
However, the bears were active near the $2,550 resistance zone. A high was formed at $2,555 before there was a downside correction. The price declined below the $2,450 level. It dipped below the 23.6% Fib retracement level of the upward move from the $1,911 swing low to the $2,555 high.
Besides, there was a break below a connecting bullish trend line with support at $2,500 on the hourly chart of ETH/USD. The pair tested the $2,320 support and is currently rising.
Ethereum price is still trading below $2,550 and the 100-hourly Simple Moving Average. On the upside, the price is facing hurdles near the $2,500 level. The first major resistance is near the $2,550 level and the 100-hourly Simple Moving Average.
A close above the $2,550 level might send Ether toward the $2,685 resistance. The next key resistance is near $2,865. An upside break above the $2,865 resistance might send the price higher toward the $3,000 resistance zone in the near term.
Another Decline In ETH?If Ethereum fails to clear the $2,550 resistance, it could start another decline. Initial support on the downside is near $2,350. The first major support sits near the $2,300 zone.
A clear move below the $2,300 support might push the price toward $2,150 and the 61.8% Fib retracement level of the upward move from the $1,911 swing low to the $2,555 high. Any more losses might send the price toward the $2,120 support level in the near term. The next key support sits at $2,050.
Technical Indicators
Hourly MACD – The MACD for ETH/USD is gaining momentum in the bullish zone.
Hourly RSI – The RSI for ETH/USD is now above the 50 zone.
Major Support Level – $2,300
Major Resistance Level – $2,550
Original source
Read on NewsBTCRelated market context

Uranium Holds Above $85 as Mining ETF Rebounds From June Sell-Off
The latest charts display that the market is divided into stable physical prices and uranium shares trying to regain momentum afte...

Bitcoin price challenges $64,000 weekend wall – needing a breakout or risk a deeper correction
Bitcoin reclaimed $64,000 on June 12 and touched an intraday high of $64,301 in the same session that spot ETF flows finally flipp...

Standard Chartered Says Bitcoin Bottomed Near $59,000 As Crypto Winter Ends
TL;DR Standard Chartered’s Geoffrey Kendrick reportedly says Bitcoin’s $59,000 area marked the cycle bottom. The note cites SpaceX...

Elon Musk’s trillionaire status puts his net worth above crypto’s entire market cap outside Bitcoin
Elon Musk has become the first person in modern history to amass a personal net worth exceeding $1 trillion, crossing the historic...

Google Gemini AI Predicts Jaw-Dropping XRP Price For Next 90 Days
Google Gemini AI just put XRP back under the spotlight, predicting it is tightly wound for a major breakout toward $1.60 to $1.80...

Elon Musk SpaceX AI Predicts Incredible Bitcoin Price For Next 30 Days
Here is the thing about capitulation calls. They only sound smart in hindsight. Right now, with Bitcoin price scraping along the l...