Ethereum Price Signaled “Sell” And Remains At Risk of More Losses
Ethereum price is showing bearish signs below $1,920 against the US Dollar. ETH could continue to move down if it clears the $1,800 support zone. Ethereum failed to recover and stayed well below the $1,920 resistance. Th...

Ethereum price is showing bearish signs below $1,920 against the US Dollar. ETH could continue to move down if it clears the $1,800 support zone.
- Ethereum failed to recover and stayed well below the $1,920 resistance.
- The price is trading below $1,900 and the 100-hourly Simple Moving Average.
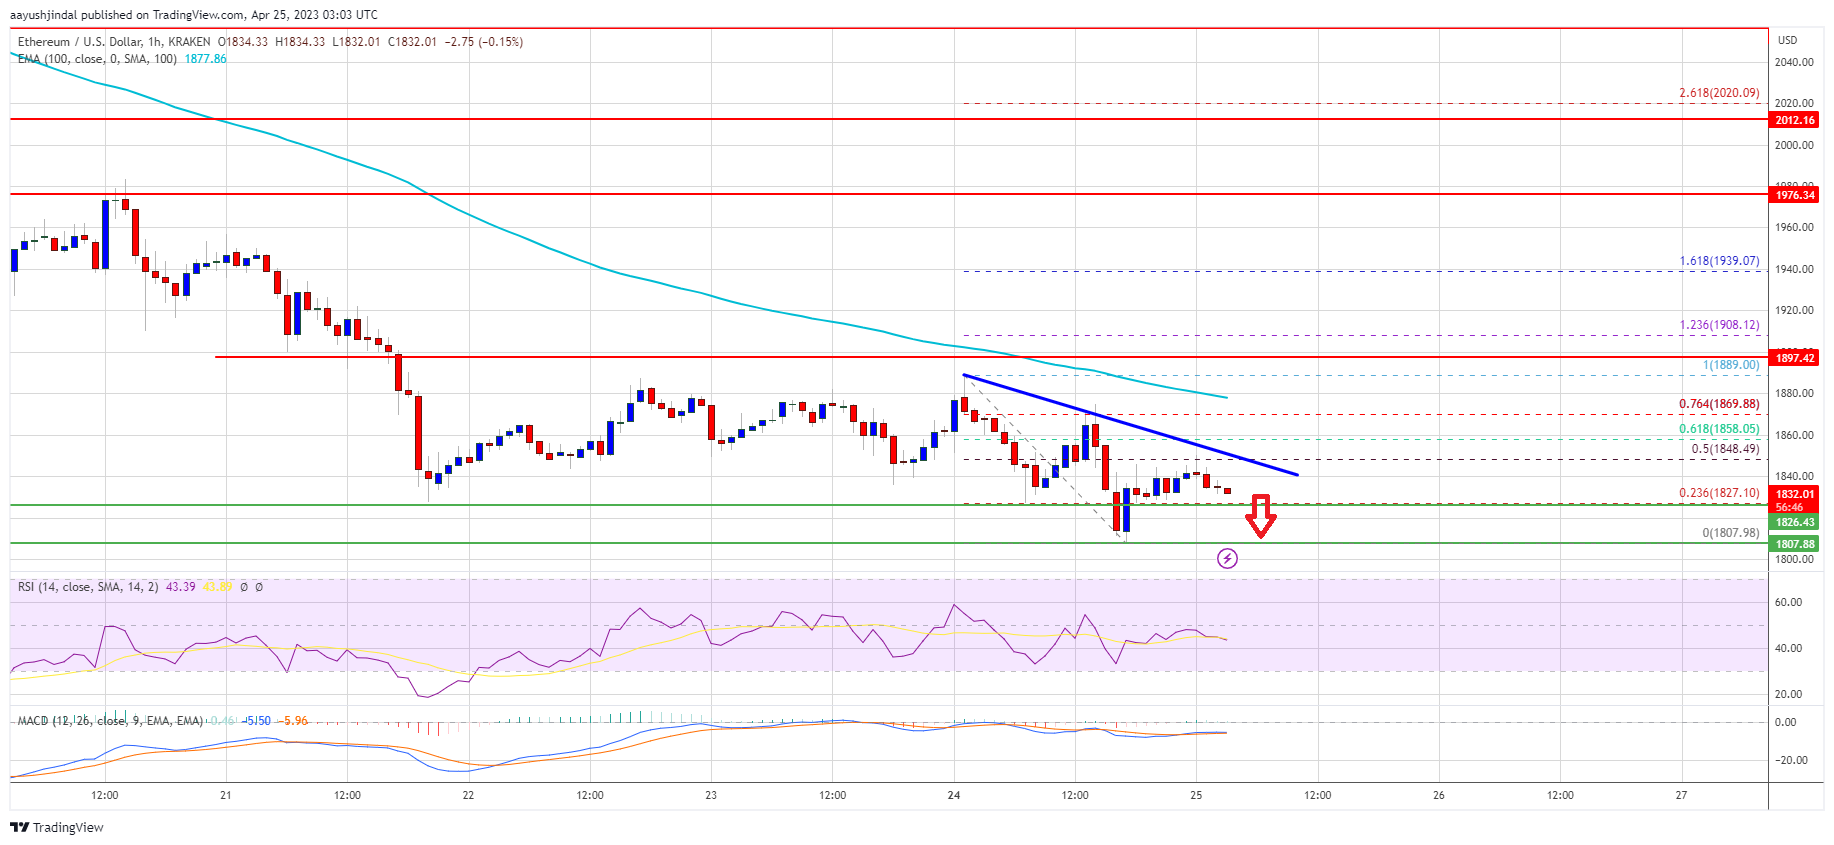
- There is a key bearish trend line forming with resistance near $1,845 on the hourly chart of ETH/USD (data feed via Kraken).
- The pair could start an upside correction if it clears the $1,850 and $1,880 levels.
Ethereum’s price attempted a short-term upside correction from the $1,820 zone. ETH climbed above the $1,850 resistance zone but upsides were limited, similar to Bitcoin.
Ether traded as high as $1,889 and recently started a fresh decline. There was a break below the $1,820 level. A new weekly low is formed near $1,807 and the price is now consolidating losses. It is trading below $1,900 and the 100-hourly Simple Moving Average.
There is also a key bearish trend line forming with resistance near $1,845 on the hourly chart of ETH/USD. Immediate resistance is near the $1,845 zone and the trend line. It is close to the 50% Fib retracement level of the recent decline from the $1,889 high to the $1,807 low.
The next major resistance is near $1,860 or the 61.8% Fib retracement level of the recent decline from the $1,889 high to the $1,807 low. An upside break above $1,860 might send Ethereum toward $1,900. The main resistance is still near the $1,920 level.
Source: ETHUSD on TradingView.com
If the bulls can push Ether above the $1,920 level, there could be a steady increase. In the stated case, the price could rise toward the $2,000 resistance. Any more gains could send Ether toward the $2,080 resistance.
More Losses in ETH?If Ethereum fails to clear the $1,845 resistance, it could continue to move down. Initial support on the downside is near the $1,810 level.
The next major support is near the $1,800 zone, below which ether price might gain bearish momentum. In the stated case, the price might decline toward $1,765. Any more losses may perhaps take the price toward $1,700.
Technical Indicators
Hourly MACD – The MACD for ETH/USD is now gaining momentum in the bearish zone.
Hourly RSI – The RSI for ETH/USD is below the 50 level.
Major Support Level – $1,800
Major Resistance Level – $1,920
Original source
Read on NewsBTCRelated market context

Tether USDT Briefly Overtakes Ethereum in Market Cap: A $187B Wake-Up Call
For a few hours, earlier this week, Tether USDT stablecoin held a higher market cap than Ethereum, the first time that has happene...

Michael Saylor says investor confidence in Ethereum has collapsed
Ethereum's declining investor confidence signals a shift towards Bitcoin dominance, emphasizing real-world utility over speculativ...

Standard Chartered Says Bitcoin Bottomed Near $59,000 As Crypto Winter Ends
TL;DR Standard Chartered’s Geoffrey Kendrick reportedly says Bitcoin’s $59,000 area marked the cycle bottom. The note cites SpaceX...

XRP aims for $0.90 as ETF demand battles selling pressure from whales
XRP is trading at $1.11, down roughly 17% from its June opening, having set a new 2026 low on June 5 and shed $8 billion in market...

Crypto Today: Bitcoin ETF Rumours, Ethereum Strength, and Mining Heat for Canadian Homes
Bitcoin ETF rumours lift sentiment, Ethereum recaptures $3,800, and North Vancouver uses mining heat for homes. Coinbase unveils p...

Google Gemini AI Predicts Jaw-Dropping XRP Price For Next 90 Days
Google Gemini AI just put XRP back under the spotlight, predicting it is tightly wound for a major breakout toward $1.60 to $1.80...