Ethereum Price Signals Bearish Moves, Test of $1,100 Seems Possible
Ethereum is still showing bearish signs below the $1,200 zone against the US Dollar. ETH could continue to move down below the $1,180 support zone. Ethereum is attempting a minor upside correction towards the $1,200 barr...

Ethereum is still showing bearish signs below the $1,200 zone against the US Dollar. ETH could continue to move down below the $1,180 support zone.
- Ethereum is attempting a minor upside correction towards the $1,200 barrier.
- The price is now trading below $1,200 and the 100 hourly simple moving average.
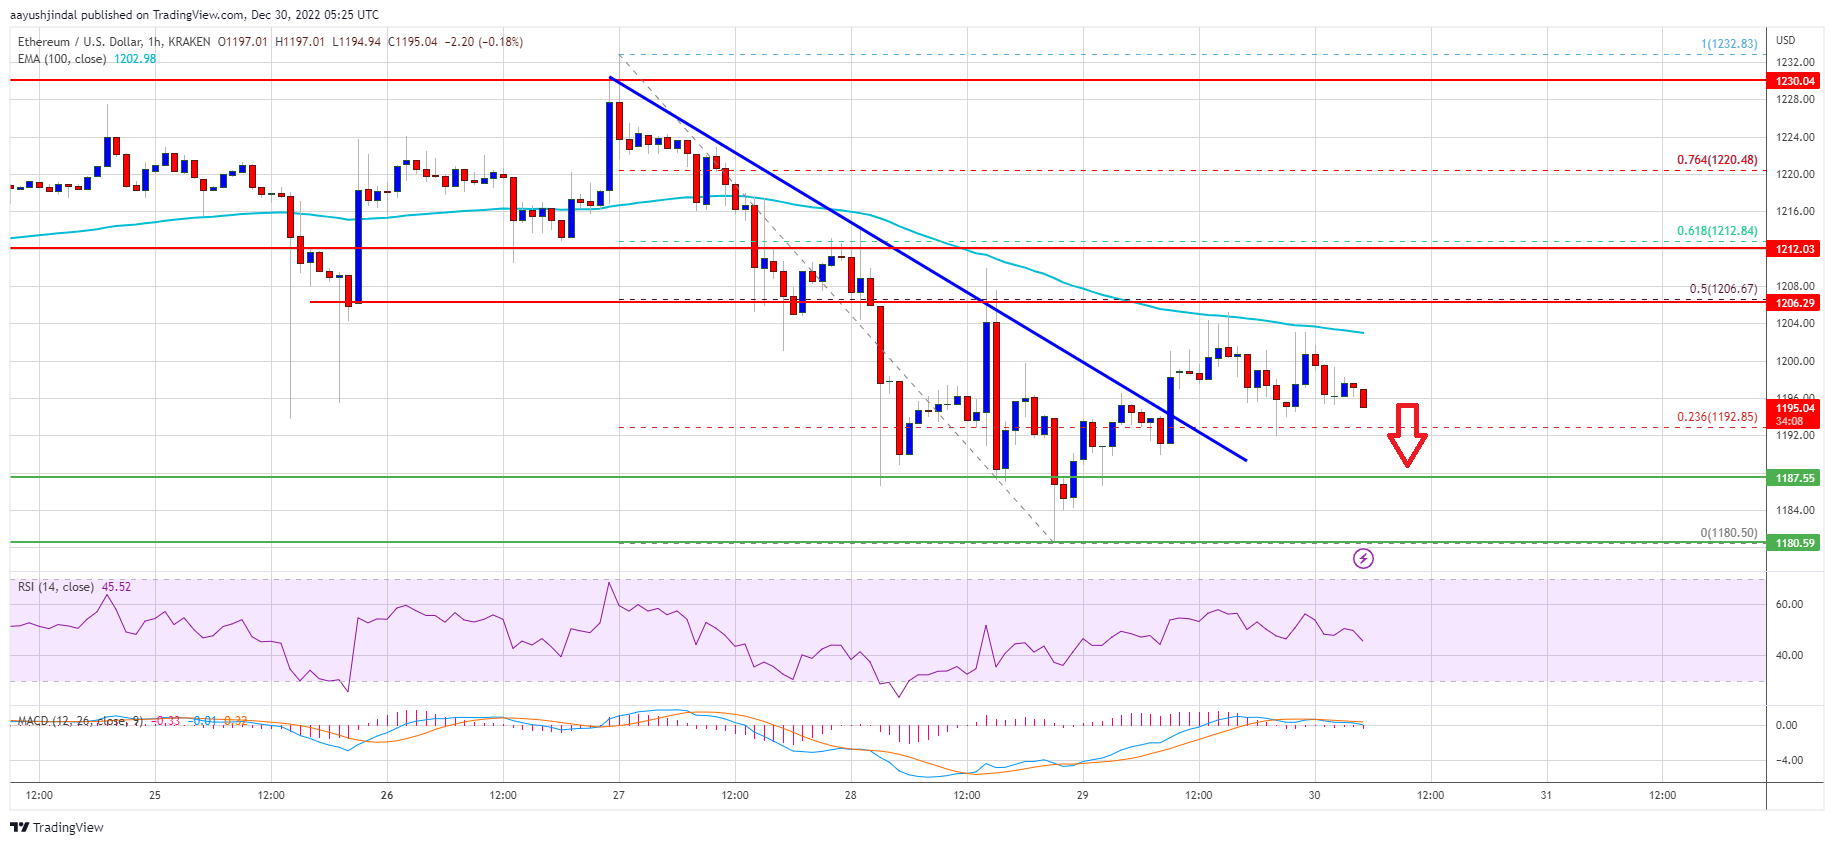
- There was a break above a key bearish trend line with resistance near $1,195 on the hourly chart of ETH/USD (data feed via Kraken).
- The pair remains at a risk of a larger decline towards the $1,100 level or even $1,000.
Ethereum price remained stable near the $1,180 level. ETH formed a base and started a minor upside correction from $1,180, similar to bitcoin.
The price was able to climb above the $1,185 and $1,190 levels. There was a break above a key bearish trend line with resistance near $1,195 on the hourly chart of ETH/USD. The pair even climbed above the 23.6% Fib retracement level of the key decline from the $1,232 swing high to $1,180 low.
However, the bears are active below the $1,220 level. Ether price is now trading below $1,200 and the 100 hourly simple moving average.
An immediate resistance is near the $1,205 level and the 100 hourly SMA. It is near the 50% Fib retracement level of the key decline from the $1,232 swing high to $1,180 low. The next major resistance is near the $1,212 level. The first major resistance is near $1,230.
Source: ETHUSD on TradingView.com
A close above the $1,230 resistance could start a decent upward move. In the stated case, the price may perhaps rise towards the $1,250 resistance. The next major resistance could be $1,265, above which the price might rise towards the $1,300 resistance zone.
Fresh Decline in ETH?If ethereum fails to climb above the $1,220 resistance, it could start another drop. An initial support on the downside is near the $1,188 level.
The next major support is near the $1,180 level. A downside break below $1,180 might send the price towards the $1,120 support. Any more losses might call for a test of the $1,100 zone.
Technical Indicators
Hourly MACD – The MACD for ETH/USD is now gaining momentum in the bearish zone.
Hourly RSI – The RSI for ETH/USD is now below the 50 level.
Major Support Level – $1,180
Major Resistance Level – $1,220
Original source
Read on NewsBTCRelated market context

Uranium Holds Above $85 as Mining ETF Rebounds From June Sell-Off
The latest charts display that the market is divided into stable physical prices and uranium shares trying to regain momentum afte...

Standard Chartered Says Bitcoin Bottomed Near $59,000 As Crypto Winter Ends
TL;DR Standard Chartered’s Geoffrey Kendrick reportedly says Bitcoin’s $59,000 area marked the cycle bottom. The note cites SpaceX...

Google Gemini AI Predicts Jaw-Dropping XRP Price For Next 90 Days
Google Gemini AI just put XRP back under the spotlight, predicting it is tightly wound for a major breakout toward $1.60 to $1.80...

Bitcoin price challenges $64,000 weekend wall – needing a breakout or risk a deeper correction
Bitcoin reclaimed $64,000 on June 12 and touched an intraday high of $64,301 in the same session that spot ETF flows finally flipp...

Bitcoin rises above $64,000 after Pakistan prime minister says Iran peace deal is near
Bitcoin traded above $64,000 on Saturday, supported by its strongest ETF inflows in a month and growing optimism around geopolitic...

US forces shoot down Iranian attack drones near Strait of Hormuz, Bitcoin drops below $73K
Geopolitical tensions near vital oil routes can destabilize financial markets, highlighting the interconnectedness of global secur...