Ethereum Price Signals Bearish Rection, Why ETH Could Drop 5%
Ethereum price is struggling to clear the $2,300 resistance zone. ETH is showing a few bearish signs and might decline toward the $2,080 support. Ethereum is still struggling to clear the $2,280 and $2,300 resistance lev...

Ethereum price is struggling to clear the $2,300 resistance zone. ETH is showing a few bearish signs and might decline toward the $2,080 support.
- Ethereum is still struggling to clear the $2,280 and $2,300 resistance levels.
- The price is trading below $2,260 and the 100-hourly Simple Moving Average.
- There is a connecting bearish trend line forming with resistance near $2,240 on the hourly chart of ETH/USD (data feed via Kraken).
- The pair could extend its decline if it stays below the $2,300 resistance zone.
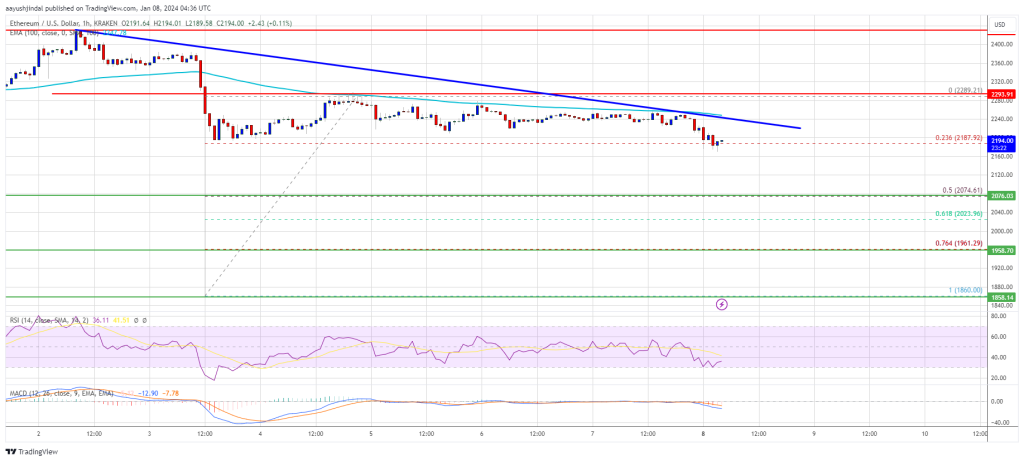
Ethereum price attempted a fresh increase above the $2,200 level, like Bitcoin. ETH climbed above the $2,250 and $2,260 levels. However, the bears were active near $2,300 and the 100-hourly Simple Moving Average.
A high was formed near $2,289 and the price recently saw a bearish reaction. There was a move below the $2,250 level. The price traded below the 23.6% Fib retracement level of the upward wave from the $1,860 swing low to the $2,289 high.
Ethereum is now trading below $2,260 and the 100-hourly Simple Moving Average. There is also a connecting bearish trend line forming with resistance near $2,240 on the hourly chart of ETH/USD.
If there is a fresh increase, the price might face resistance near the $2,250 level and the trend line. The first major resistance is now near $2,280. The next major hurdle sits at $2,300.
Source: ETHUSD on TradingView.com
A close above the $2,300 resistance could start a decent upward move. The next key resistance is near $2,400. If the bulls push Ethereum above $2,400, there could be a rally toward $2,500. Any more gains might send the price toward the $2,620 zone.
More Losses in ETH?If Ethereum fails to clear the $2,250 resistance, it could start a fresh decline. Initial support on the downside is near the $2,120 level.
The first key support could be the $2,080 zone or the 50% Fib retracement level of the upward wave from the $1,860 swing low to the $2,289 high. A downside break and a close below $2,080 might spark strong bearish moves. In the stated case, Ether could test the $2,020 support. Any more losses might send the price toward the $1,960 level.
Technical Indicators
Hourly MACD – The MACD for ETH/USD is gaining momentum in the bearish zone.
Hourly RSI – The RSI for ETH/USD is now below the 50 level.
Major Support Level – $2,080
Major Resistance Level – $2,280
Original source
Read on NewsBTCRelated market context

Ethereum Price Prediction: ETH is Still Below Its 200 Week SMA, and Tom Lee Buying Spree Might End Soon
Ethereum price is trading above $1,700 after running for 5% today, and even our prediction model is calling for more leg higher. H...

Ethereum News: Last Chance to Buy Ethereum Under $2K? ETH USD Powers Up After Hormuz Peace Deal
In the latest Ethereum News, Ethereum ETH Price is trading at $1,739 up 4% in 24 hours, as risk assets catch a bid following the H...

Ethereum Research Proposal Targets Post-Quantum Wallet Security At Low Gas Cost
A new Ethereum Research proposal is putting post-quantum wallet security back in focus, outlining a practical way to verify quantu...

Bitcoin Stabilizes Near Key Zone, But Glassnode Warns Capital Flows Remain Weak
Bitcoin’s rebound from the $60,000 area has given bulls something to work with, but Glassnode’s latest market read suggests the re...
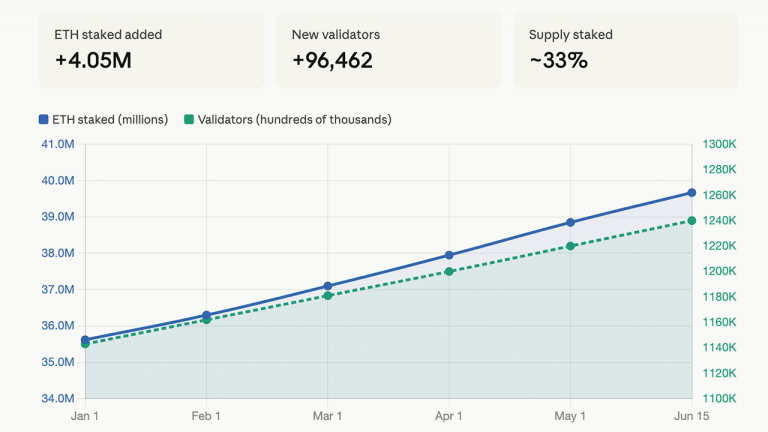
Ethereum Staking Nears 40M ETH Locked as 96,000 New Validators Join in 2026
Ethereum’s proof-of- stake network absorbed more than 4 million additional ETH in the first half of 2026, pushing total staked sup...

Most of Ripple’s own stablecoin lives on Ethereum
The majority of the Ripple USD stablecoin is on Ethereum, the top competitor to Ripple’s XRP Ledger. Indeed, $879 million of the r...