Ethereum Price Signals Recovery But 100 SMA Is The Key
Ethereum price is slowly moving higher from $1,840 against the US Dollar. ETH is still facing strong resistance near the $1,875 level and the 100 hourly SMA. Ethereum is currently consolidating losses above the $1,820 su...

Ethereum price is slowly moving higher from $1,840 against the US Dollar. ETH is still facing strong resistance near the $1,875 level and the 100 hourly SMA.
- Ethereum is currently consolidating losses above the $1,820 support zone.
- The price is trading below $1,875 and the 100-hourly Simple Moving Average.
- There was a break above a major bearish trend line with resistance near $1,850 on the hourly chart of ETH/USD (data feed via Kraken).
- The pair could struggle to clear the $1,875 and $1,880 resistance levels.
Ethereum’s price remained in a bearish zone the $1,875 support zone. ETH tested the $1,810 zone and recently started a consolidation phase, similar to Bitcoin.
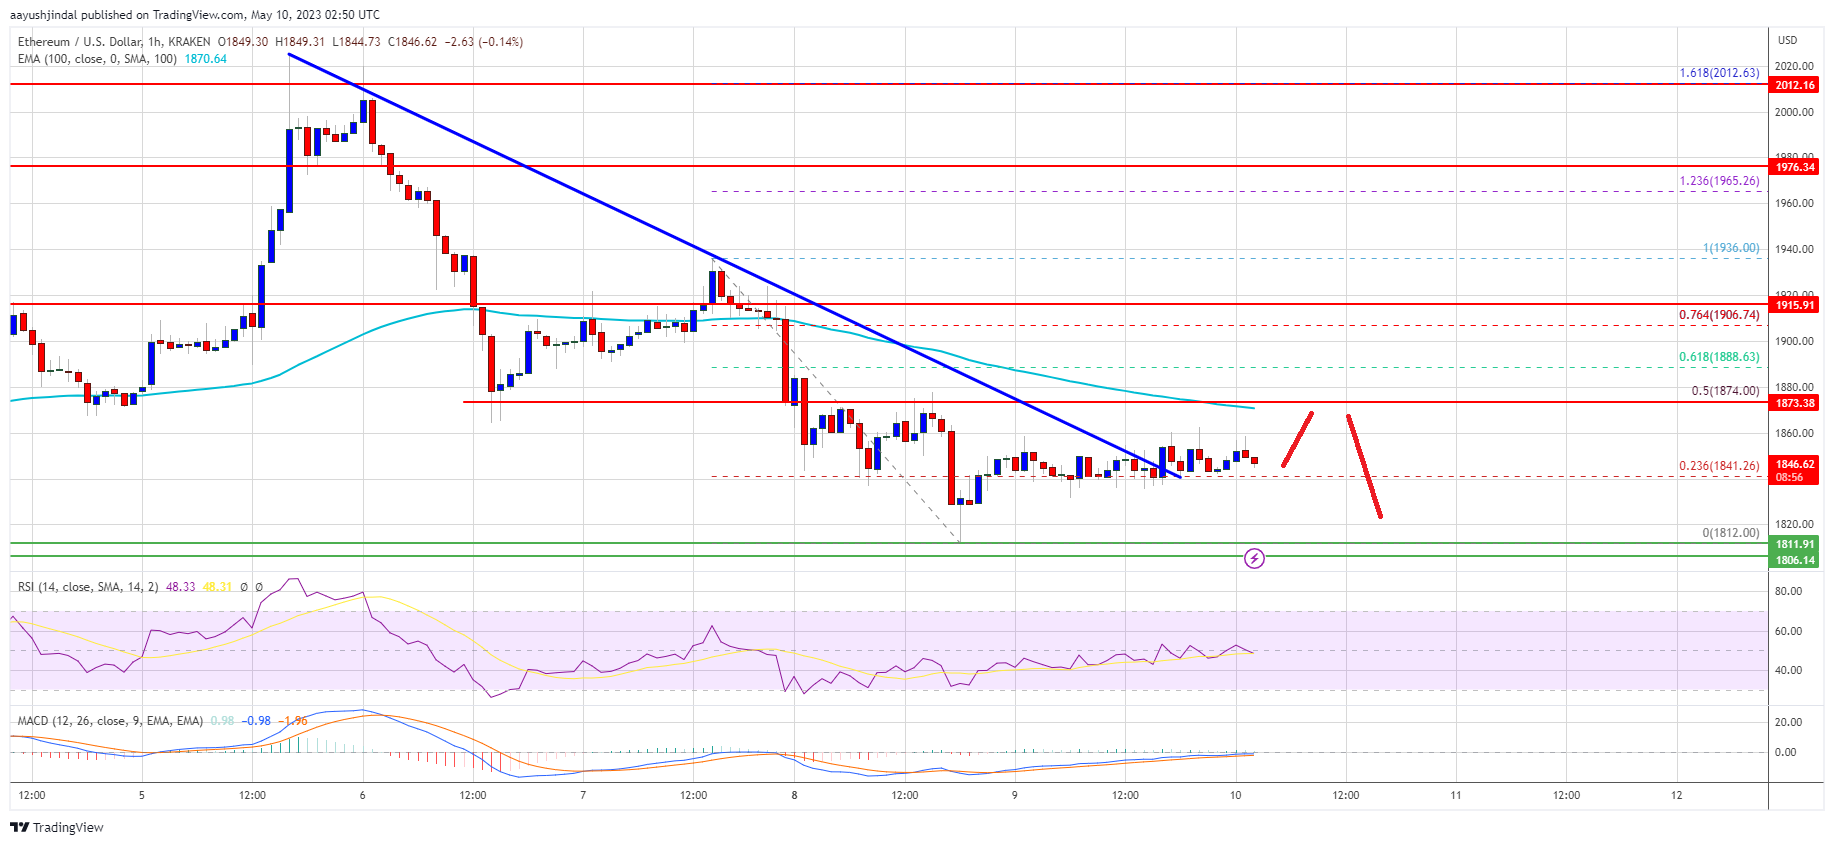
A low is formed near $1,812 and the price is slowly moving higher in a range. It traded above the 23.6% Fib retracement level of the swing move from the $1,935 high to the $1,812 low. Besides, there was a break above a major bearish trend line with resistance near $1,850 on the hourly chart of ETH/USD.
However, Ether is still trading below $1,875 and the 100-hourly Simple Moving Average. Immediate resistance is near the $1,860 level. The next resistance sits near $1,875 or the 100-hourly Simple Moving Average or the 50% Fib retracement level of the swing move from the $1,935 high to the $1,812 low.
Source: ETHUSD on TradingView.com
The next key resistance might be near the $1,920 level. A close above the $1,920 resistance zone could start a decent increase in Ethereum and the price might rise toward the $1,975 resistance. Any more gains might send the price toward the $1,950 resistance.
Fresh Decline in ETH?If Ethereum fails to clear the $1,875 resistance, it could start another decline. Initial support on the downside is near the $1,820 level or the recent low.
The next major support is near the $1,800 zone. If there is a downside break and a close below $1,800, the bears could gain strength. In the stated case, the price might drop toward the $1,720 support zone. Any more losses may perhaps take the price toward the $1,650 level in the near term.
Technical Indicators
Hourly MACD – The MACD for ETH/USD is now losing momentum in the bearish zone.
Hourly RSI – The RSI for ETH/USD is still below the 50 level.
Major Support Level – $1,800
Major Resistance Level – $1,875
Original source
Read on NewsBTCRelated market context

Standard Chartered Says Bitcoin Bottomed Near $59,000 As Crypto Winter Ends
TL;DR Standard Chartered’s Geoffrey Kendrick reportedly says Bitcoin’s $59,000 area marked the cycle bottom. The note cites SpaceX...

Google Gemini AI Predicts Jaw-Dropping XRP Price For Next 90 Days
Google Gemini AI just put XRP back under the spotlight, predicting it is tightly wound for a major breakout toward $1.60 to $1.80...

Bitcoin price challenges $64,000 weekend wall – needing a breakout or risk a deeper correction
Bitcoin reclaimed $64,000 on June 12 and touched an intraday high of $64,301 in the same session that spot ETF flows finally flipp...

Bitcoin rises above $64,000 after Pakistan prime minister says Iran peace deal is near
Bitcoin traded above $64,000 on Saturday, supported by its strongest ETF inflows in a month and growing optimism around geopolitic...

US forces shoot down Iranian attack drones near Strait of Hormuz, Bitcoin drops below $73K
Geopolitical tensions near vital oil routes can destabilize financial markets, highlighting the interconnectedness of global secur...

Bitcoin Mining Cost Model Points To $47,000 Floor, But Analysts Urge Caution
TL;DR Crypto Rover says Bitcoin has never bottomed below electrical production cost, currently estimated at $47,000. Mining-cost m...