Ethereum Price Suffers Setback, This Triangle Could Start Another Decline
Ethereum started a fresh decline from the $1,320 resistance against the US Dollar. ETH is struggling and remains at a risk of a move below $1,150. Ethereum started another decline and traded below the $1,200 support. The...

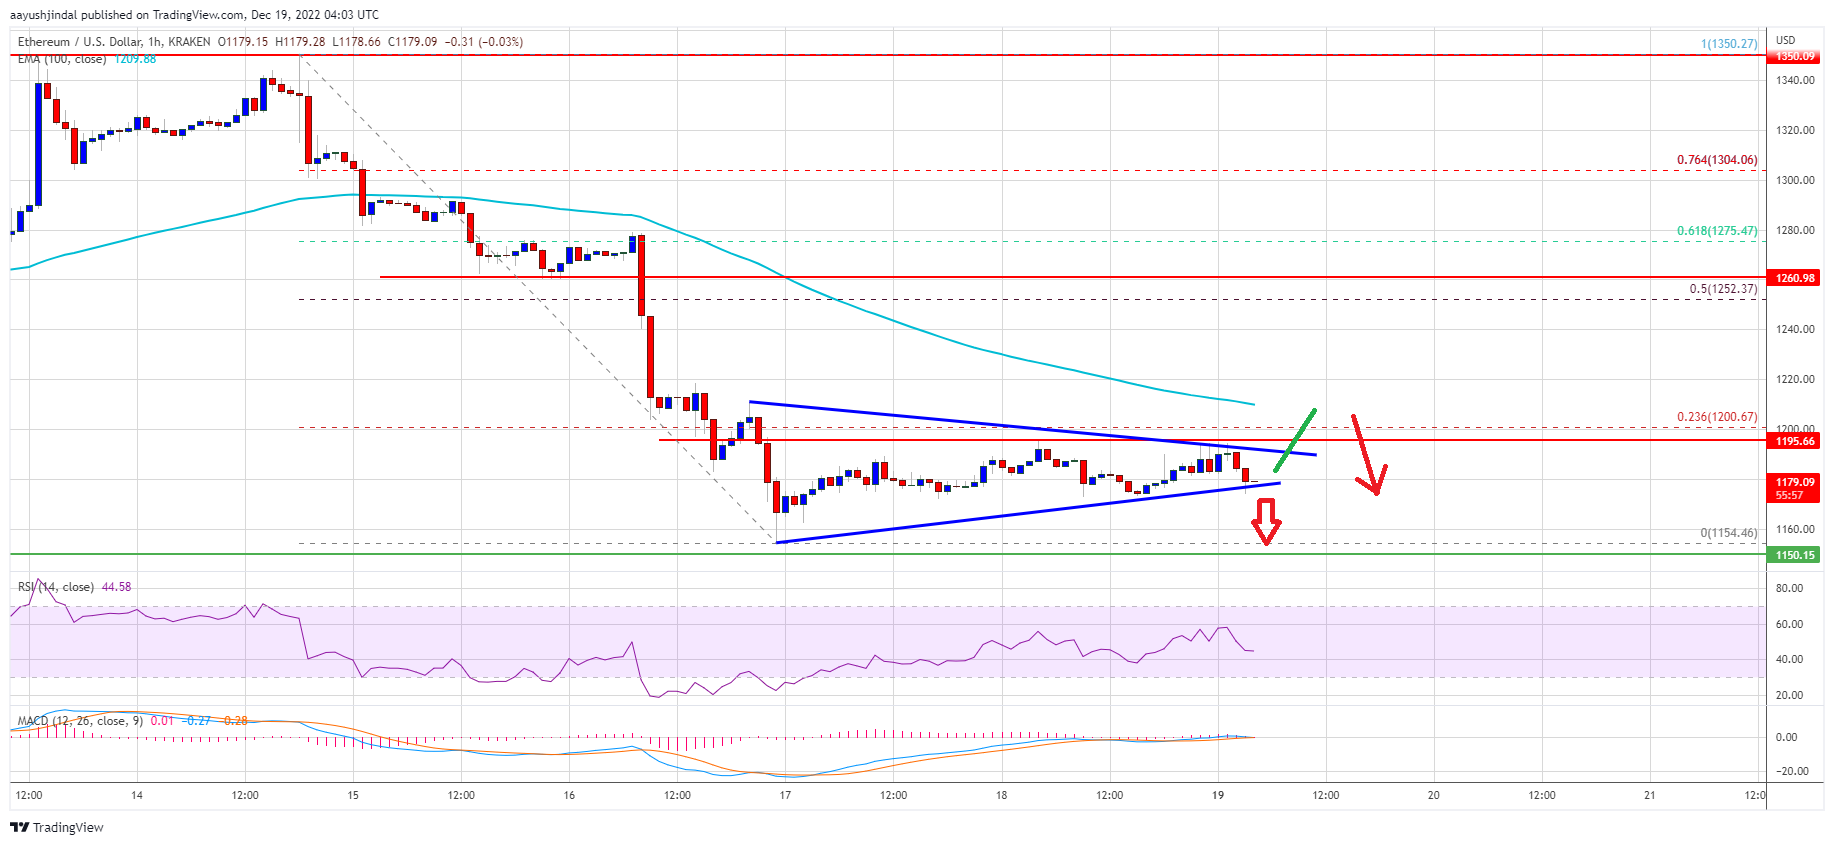
Ethereum started a fresh decline from the $1,320 resistance against the US Dollar. ETH is struggling and remains at a risk of a move below $1,150.
- Ethereum started another decline and traded below the $1,200 support.
- The price is now trading below $1,200 and the 100 hourly simple moving average.
- There is a key contracting triangle forming with resistance near $1,190 on the hourly chart of ETH/USD (data feed via Kraken).
- The pair could continue to move down unless the price climbs above the $1,220 resistance.
Ethereum price failed to stay above the $1,300 support zone. ETH reacted to the downside and traded below the $1,250 support zone to move into a bearish zone, similar to bitcoin.
The decline gained pace below the $1,200 level and the 100 hourly simple moving average. Ether price traded as low as $1,154 and is currently consolidating losses. There was a minor increase above the $1,180 resistance zone, but the bears remained active.
Ether price is now trading below $1,200 and the 100 hourly simple moving average. It is also trading below the 23.6% Fib retracement level of the downward move from the $1,350 swing high to $1,154 low.
An immediate resistance on the upside is near the $1,190 level. There is also a key contracting triangle forming with resistance near $1,190 on the hourly chart of ETH/USD. The first major resistance is near the $1,210 level and the 100 hourly simple moving average.
Source: ETHUSD on TradingView.com
A close above the $1,220 resistance might start a decent increase. The next major resistance could be $1,260 or the 50% Fib retracement level of the downward move from the $1,350 swing high to $1,154 low, above which ether could rise towards $1,300. Any more gains might send the price towards the $1,350 resistance zone.
More Losses in ETH?If ethereum fails to climb above the $1,220 resistance, it could continue to move down. An initial support on the downside is near the $1,170 level.
The next major support is near the $1,150 level, below which the price could gain bearish momentum towards the $1,100 support. Any more losses could lead the price towards the $1,050 support.
Technical Indicators
Hourly MACD – The MACD for ETH/USD is now gaining momentum in the bearish zone.
Hourly RSI – The RSI for ETH/USD is now below the 50 level.
Major Support Level – $1,150
Major Resistance Level – $1,220
Original source
Read on NewsBTCRelated market context

Uranium Holds Above $85 as Mining ETF Rebounds From June Sell-Off
The latest charts display that the market is divided into stable physical prices and uranium shares trying to regain momentum afte...

Standard Chartered Says Bitcoin Bottomed Near $59,000 As Crypto Winter Ends
TL;DR Standard Chartered’s Geoffrey Kendrick reportedly says Bitcoin’s $59,000 area marked the cycle bottom. The note cites SpaceX...

Bitcoin price challenges $64,000 weekend wall – needing a breakout or risk a deeper correction
Bitcoin reclaimed $64,000 on June 12 and touched an intraday high of $64,301 in the same session that spot ETF flows finally flipp...

Elon Musk’s trillionaire status puts his net worth above crypto’s entire market cap outside Bitcoin
Elon Musk has become the first person in modern history to amass a personal net worth exceeding $1 trillion, crossing the historic...

Google Gemini AI Predicts Jaw-Dropping XRP Price For Next 90 Days
Google Gemini AI just put XRP back under the spotlight, predicting it is tightly wound for a major breakout toward $1.60 to $1.80...

Bitcoin rises above $64,000 after Pakistan prime minister says Iran peace deal is near
Bitcoin traded above $64,000 on Saturday, supported by its strongest ETF inflows in a month and growing optimism around geopolitic...