Ethereum Price Takes a Big Hit: Main Reasons $1,720 or $1,650 Are Likely Targets
Ethereum price started a fresh decline below the $1,850 level against the US Dollar. ETH is at risk of a drop toward the $1,650 support zone in the near term. Ethereum is moving lower below the $1,880 support zone. The p...

Ethereum price started a fresh decline below the $1,850 level against the US Dollar. ETH is at risk of a drop toward the $1,650 support zone in the near term.
- Ethereum is moving lower below the $1,880 support zone.
- The price is trading below $1,860 and the 100-hourly Simple Moving Average.
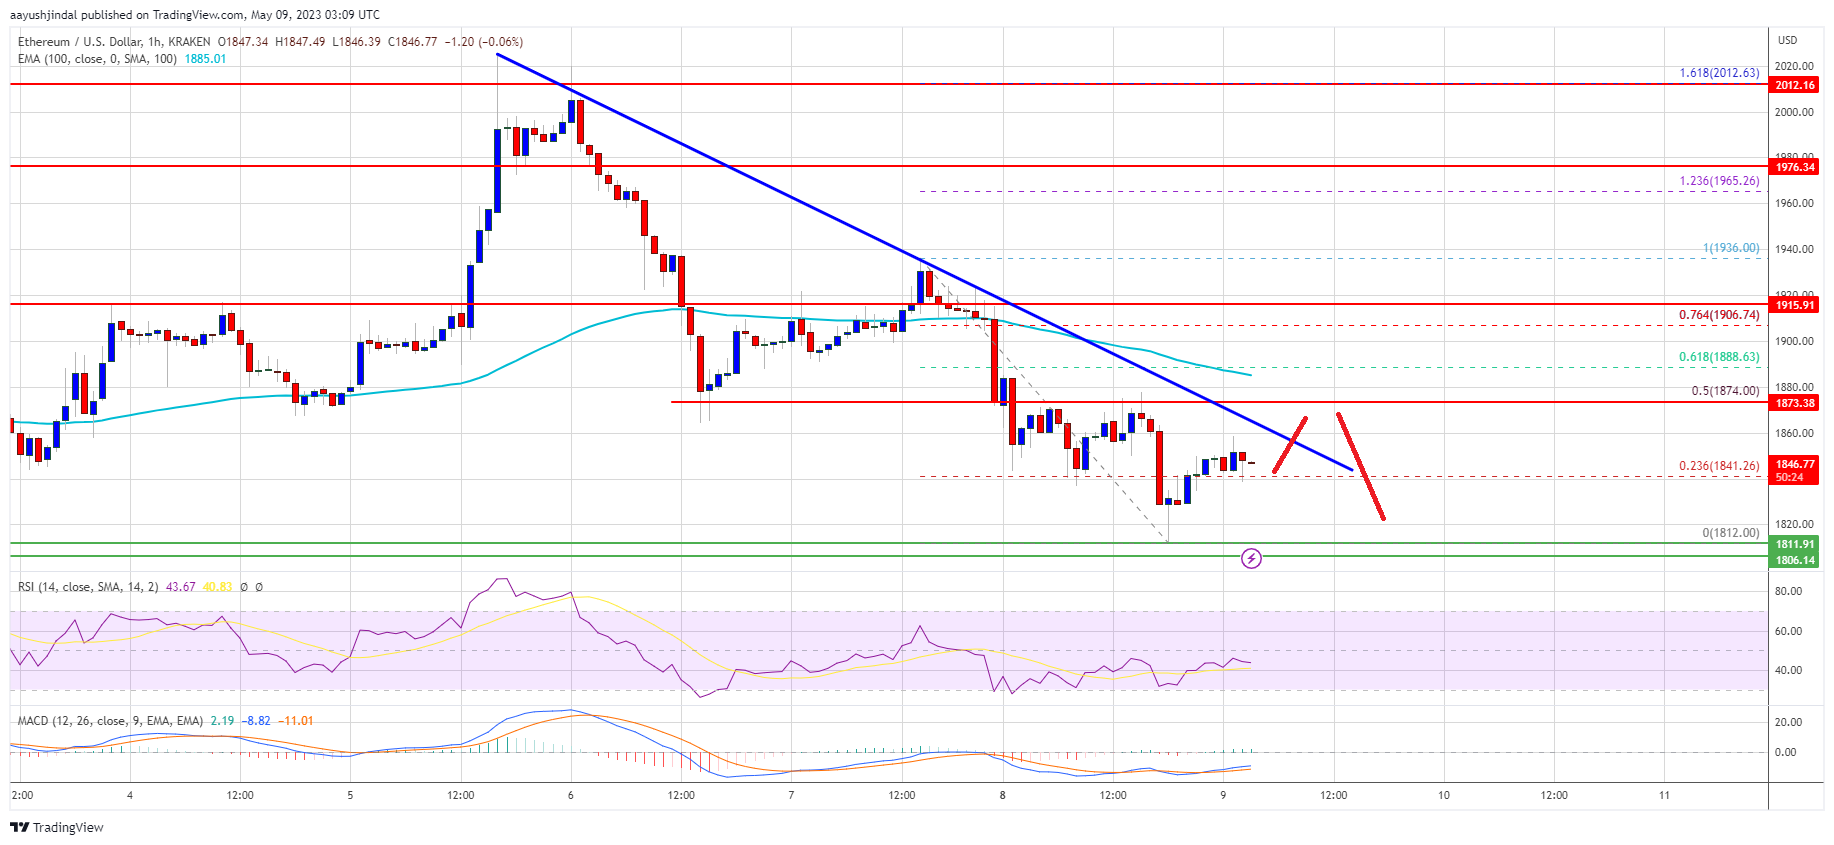
- There is a key bearish trend line forming with resistance near $1,860 on the hourly chart of ETH/USD (data feed via Kraken).
- The pair could continue to move down if there is a clear move below $1,800.
Ethereum’s price started a fresh decline and traded below the $1,880 support zone. ETH even moved below the $1,850 support to enter a bearish zone, similar to Bitcoin.
The price traded close to the $1,800 level. A low is formed near $1,812 and the price is now consolidating losses. It is trading below $1,860 and the 100-hourly Simple Moving Average. There is also a key bearish trend line forming with resistance near $1,860 on the hourly chart of ETH/USD.
Immediate resistance is near the $1,860 level and the trend line. The next resistance sits near $1,875 or the 50% Fib retracement level of the downward move from the $1,936 high to the $1,812 low.
The first major resistance seems to be forming near the $1,888 level or the 100-hourly Simple Moving Average. It is close to the 61.8% Fib retracement level of the downward move from the $1,936 high to the $1,812 low. A close above the $1,888 resistance zone could send Ethereum toward the $1,920 resistance.
Source: ETHUSD on TradingView.com
Any more gains might start a decent increase toward the $1,950 resistance. In the stated case, the price may even rise toward the $2,000 resistance. The next key resistance is near $2,050.
More Losses in ETH?If Ethereum fails to clear the $1,888 resistance, it could continue to move down. Initial support on the downside is near the $1,810 level or the recent low.
The next major support is near the $1,800 zone, below which ether price might drop toward the $1,720 support zone. Any more losses may perhaps take the price toward the $1,650 level in the near term.
Technical Indicators
Hourly MACD – The MACD for ETH/USD is now gaining momentum in the bearish zone.
Hourly RSI – The RSI for ETH/USD is now below the 50 level.
Major Support Level – $1,800
Major Resistance Level – $1,888
Original source
Read on NewsBTCRelated market context

Fireblocks Says Institutional ETH Staking Is Moving Toward Standardized Rails
TL;DR Fireblocks says it has launched ETH Staking Link, a standardized interface for institutional Ethereum staking integrations....

Standard Chartered Says Bitcoin Bottomed Near $59,000 As Crypto Winter Ends
TL;DR Standard Chartered’s Geoffrey Kendrick reportedly says Bitcoin’s $59,000 area marked the cycle bottom. The note cites SpaceX...

Uranium Holds Above $85 as Mining ETF Rebounds From June Sell-Off
The latest charts display that the market is divided into stable physical prices and uranium shares trying to regain momentum afte...

Tether USDT Briefly Overtakes Ethereum in Market Cap: A $187B Wake-Up Call
For a few hours, earlier this week, Tether USDT stablecoin held a higher market cap than Ethereum, the first time that has happene...

Google Gemini AI Predicts Jaw-Dropping XRP Price For Next 90 Days
Google Gemini AI just put XRP back under the spotlight, predicting it is tightly wound for a major breakout toward $1.60 to $1.80...

Bitcoin price challenges $64,000 weekend wall – needing a breakout or risk a deeper correction
Bitcoin reclaimed $64,000 on June 12 and touched an intraday high of $64,301 in the same session that spot ETF flows finally flipp...