Ethereum Price Tops At 100 SMA, Why ETH Could Struggle In Near Term
Ethereum price failed to recover further above the $2,300 resistance. ETH is showing a few bearish signs and might revisit the $2,080 support. Ethereum is struggling to clear the $2,280 and $2,300 resistance levels. The...

Ethereum price failed to recover further above the $2,300 resistance. ETH is showing a few bearish signs and might revisit the $2,080 support.
- Ethereum is struggling to clear the $2,280 and $2,300 resistance levels.
- The price is trading below $2,300 and the 100-hourly Simple Moving Average.
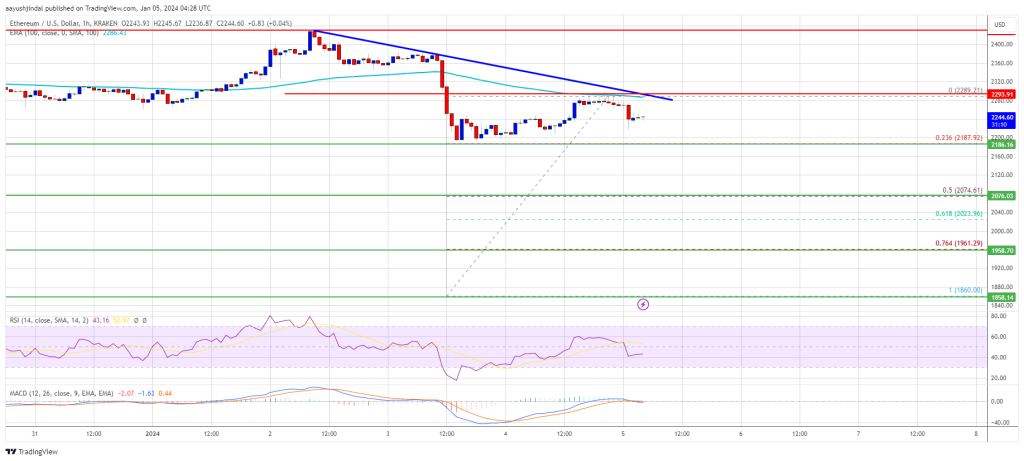
- There is a major bearish trend line forming with resistance near $2,280 on the hourly chart of ETH/USD (data feed via Kraken).
- The pair could start a fresh decline if it stays below the $2,300 resistance zone.
Ethereum price started a recovery wave above the $2,120 level, like Bitcoin. ETH was able to clear the $2,200 and $2,220 resistance levels. However, the bears were active near $2,300 and the 100-hourly Simple Moving Average.
The price failed to clear the 76.4% Fib retracement level of the downward move from the $2,430 swing high to the $1,860 low. It is now struggling to clear the $2,280 and $2,300 resistance levels. There is also a major bearish trend line forming with resistance near $2,280 on the hourly chart of ETH/USD.
Ethereum is now below $2,300 and the 100-hourly Simple Moving Average, but it is still above the 23.6% Fib retracement level of the upward move from the $1,860 swing low to the $2,289 high.
On the upside, the price is facing resistance near the $2,280 level and the trend line. The first major resistance is now near $2,300. A close above the $2,300 resistance could start a decent upward move. The next key resistance is near $2,400.
Source: ETHUSD on TradingView.com
If there is a clear move above $2,400, there could be a drift toward $2,500. The next resistance sits at $2,500, above which Ethereum might rally and test the $2,620 zone.
Fresh Decline in ETH?If Ethereum fails to clear the $2,300 resistance, it could start a fresh decline. Initial support on the downside is near the $2,185 level.
The first key support could be the $2,075 zone or the 50% Fib retracement level of the upward move from the $1,860 swing low to the $2,289 high. A downside break and a close below $2,075 might start another steady decline. In the stated case, Ether could test the $2,000 support. Any more losses might send the price toward the $1,860 level.
Technical Indicators
Hourly MACD – The MACD for ETH/USD is losing momentum in the bullish zone.
Hourly RSI – The RSI for ETH/USD is now below the 50 level.
Major Support Level – $2,185
Major Resistance Level – $2,300
Original source
Read on NewsBTCRelated market context

Bitcoin Stabilizes Near Key Zone, But Glassnode Warns Capital Flows Remain Weak
Bitcoin’s rebound from the $60,000 area has given bulls something to work with, but Glassnode’s latest market read suggests the re...

BTC News Today: Bitcoin Climbs Toward $66K as Trump Reveals US-Iran Peace Deal
The renewed geopolitical optimism helped improve risk sentiment across financial markets, pushing Bitcoin back toward the $66,000...

Bitcoin’s Iran rally faces Japan rate test as it weighs 31-year high
Bitcoin's current relief rally is built on the back of the framework agreement between the US and Iran to halt their conflict and...

Lummis Links Bitcoin to $39.2T US Debt Crisis as CLARITY Act Nears Senate Floor
Senator Cynthia Lummis publicly tied Bitcoin to America’s $39.2 trillion national debt crisis on June 15, positioning the asset as...

Ethereum Research Proposal Targets Post-Quantum Wallet Security At Low Gas Cost
A new Ethereum Research proposal is putting post-quantum wallet security back in focus, outlining a practical way to verify quantu...

Bitcoin Price and Crypto Stocks Surge as Iran Ceasefire, Strategy’s $100M Buy Collide With Fed Week
Bitcoin Magazine Bitcoin Price and Crypto Stocks Surge as Iran Ceasefire, Strategy’s $100M Buy Collide With Fed Week Bitcoin price...