Ethereum Price Topside Bias Vulnerable If It Continues To Struggle Below $1,900
Ethereum price started an upside correction above $1,850 against the US Dollar. ETH could start another decline if it continues to struggle near $1,900. Ethereum is attempting an upside correction above $1,850. The price...

Ethereum price started an upside correction above $1,850 against the US Dollar. ETH could start another decline if it continues to struggle near $1,900.
- Ethereum is attempting an upside correction above $1,850.
- The price is trading below $1,880 and the 100-hourly Simple Moving Average.
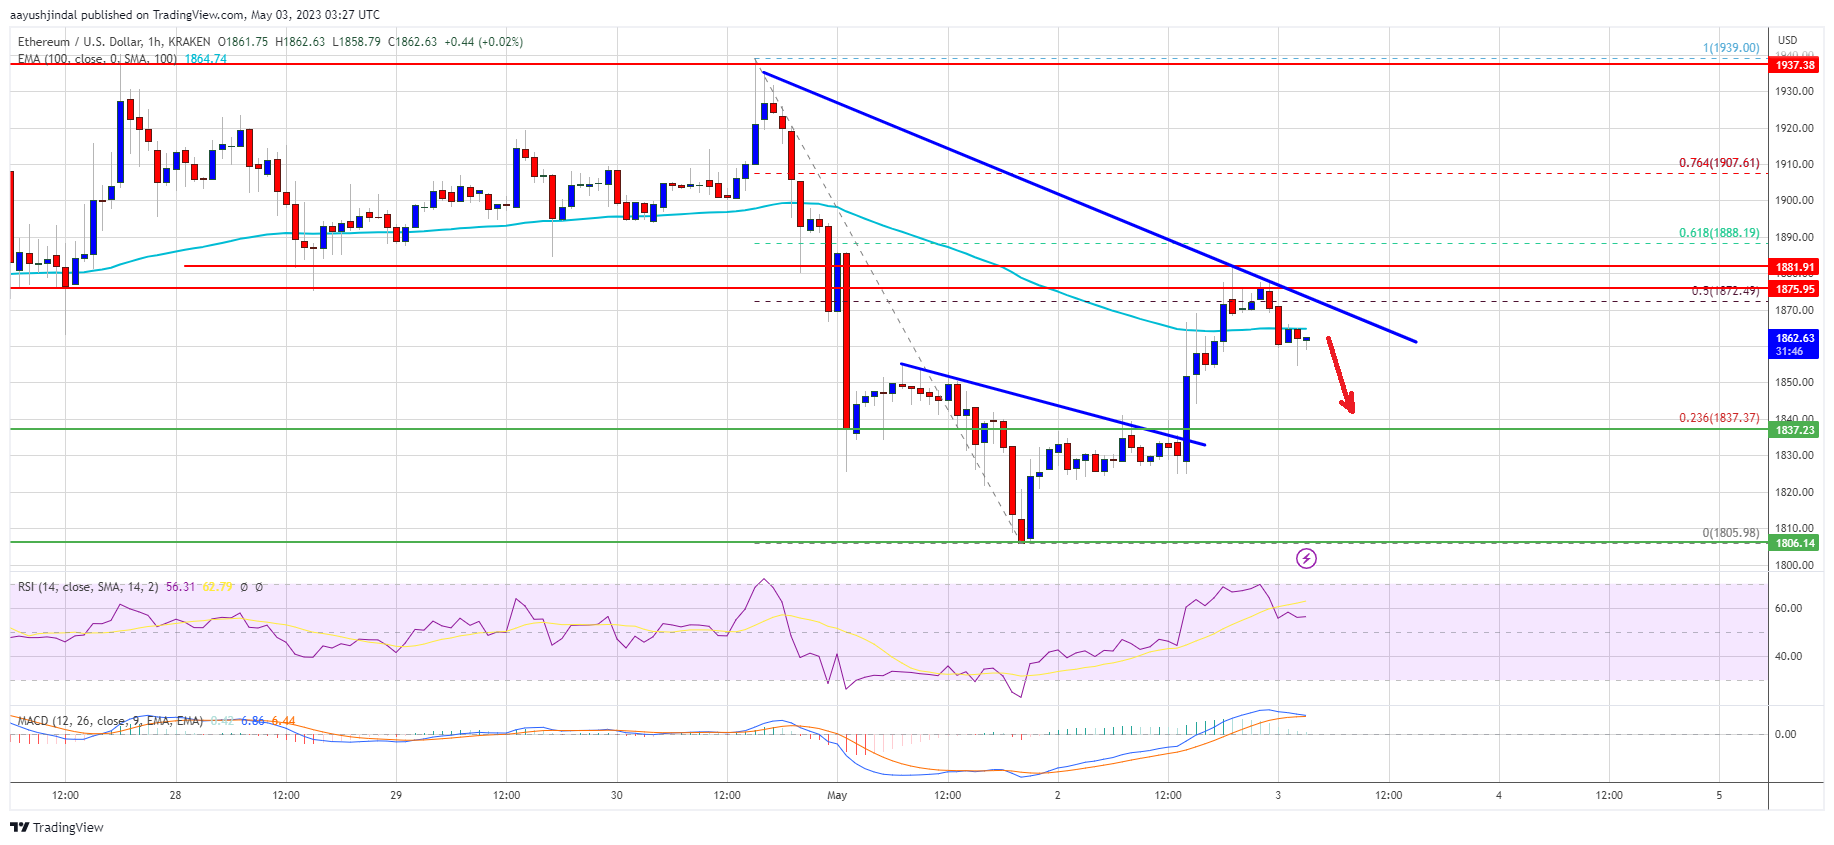
- There is a major bearish trend line forming with resistance near $1,870 on the hourly chart of ETH/USD (data feed via Kraken).
- The pair could continue to move down if it stays below $1,880 and $1,900.
Ethereum’s price managed to stay above the $1,800 support zone. ETH formed a base and recently started an upside correction above $1,850, similar to Bitcoin at $28,000.
The price was able to climb above the 23.6% Fib retracement level of the key drop from the $1,940 swing high to the $1,805 low. However, the price struggled to surpass the $1,880 resistance zone and failed to stay above the 100-hourly Simple Moving Average.
Ether is now trading below $1,880 and the 100-hourly Simple Moving Average. It seems to be facing hurdles near the 50% Fib retracement level of the key drop from the $1,940 swing high to the $1,805 low.
There is also a major bearish trend line forming with resistance near $1,870 on the hourly chart of ETH/USD. The next major resistance seems to be forming near $1,900. A close above the $1,900 level might start a fresh increase. In the stated case, the price could rise toward the $1,950 resistance.
Source: ETHUSD on TradingView.com
Any more gains could send Ether toward the $2,000 resistance. In the stated case, Ether could even attempt a move toward the $2,000 zone, above which the price could gain bullish momentum and even test $2,120.
Fresh Decline in ETH?If Ethereum fails to clear the $1,880 resistance, it could start another bearish wave. Initial support on the downside is near the $1,840 level.
The next major support is near the $1,800 zone or the last swing low, below which ether price might drop toward the $1,765 support zone. Any more losses may perhaps take the price toward the $1,720 level in the near term.
Technical Indicators
Hourly MACD – The MACD for ETH/USD is now losing momentum in the bullish zone.
Hourly RSI – The RSI for ETH/USD is above the 50 level.
Major Support Level – $1,840
Major Resistance Level – $1,880
Original source
Read on NewsBTCRelated market context

Tether USDT Briefly Overtakes Ethereum in Market Cap: A $187B Wake-Up Call
For a few hours, earlier this week, Tether USDT stablecoin held a higher market cap than Ethereum, the first time that has happene...

Bitcoin price challenges $64,000 weekend wall – needing a breakout or risk a deeper correction
Bitcoin reclaimed $64,000 on June 12 and touched an intraday high of $64,301 in the same session that spot ETF flows finally flipp...

Standard Chartered Says Bitcoin Bottomed Near $59,000 As Crypto Winter Ends
TL;DR Standard Chartered’s Geoffrey Kendrick reportedly says Bitcoin’s $59,000 area marked the cycle bottom. The note cites SpaceX...

Google Gemini AI Predicts Jaw-Dropping XRP Price For Next 90 Days
Google Gemini AI just put XRP back under the spotlight, predicting it is tightly wound for a major breakout toward $1.60 to $1.80...

Michael Saylor says investor confidence in Ethereum has collapsed
Ethereum's declining investor confidence signals a shift towards Bitcoin dominance, emphasizing real-world utility over speculativ...

Bitcoin Mining Cost Model Points To $47,000 Floor, But Analysts Urge Caution
TL;DR Crypto Rover says Bitcoin has never bottomed below electrical production cost, currently estimated at $47,000. Mining-cost m...