Ethereum Price Trims Gains But 100 SMA Could Trigger Fresh Increase
Ethereum price extended its increase above the $2,320 resistance zone. ETH is correcting gains but the 100 hourly SMA might provide support and start a fresh increase. Ethereum started an extended recovery wave above the...

Ethereum price extended its increase above the $2,320 resistance zone. ETH is correcting gains but the 100 hourly SMA might provide support and start a fresh increase.
- Ethereum started an extended recovery wave above the $2,320 resistance zone.
- The price is trading above $2,300 and the 100-hourly Simple Moving Average.
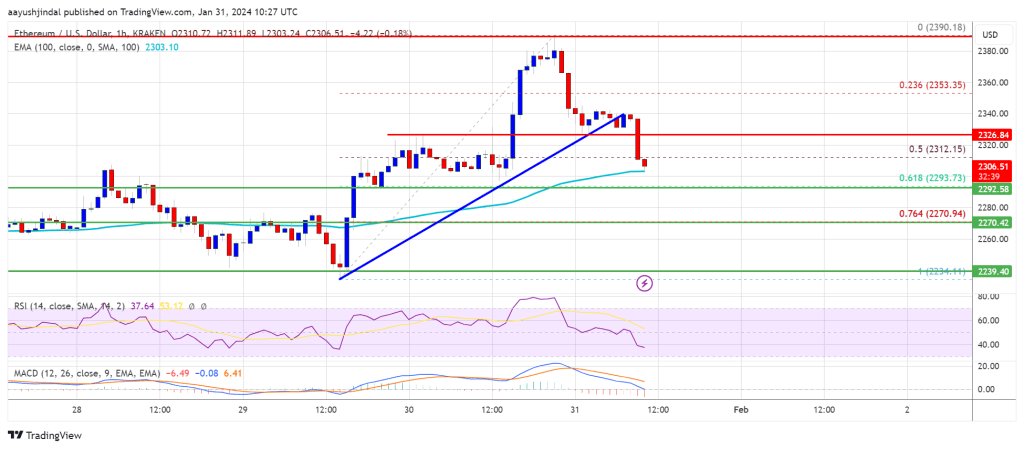
- There was a break below a key bullish trend lien with support at $2,325 on the hourly chart of ETH/USD (data feed via Kraken).
- The pair might start a fresh increase if it manages to stay above the $2,300 level.
Ethereum price remained in a positive zone above the $2,250 resistance zone. ETH cleared the $2,320 resistance to move further into a positive zone, outperforming Bitcoin.
The price traded close to the $2,400 level. A high was formed near $2,390 and the price is now correcting gains. There was a move below the $2,350 level. The price broke the 50% Fib retracement level of the upward move from the $2,235 swing low to the $2,390 high.
Besides, there was a break below a key bullish trend lien with support at $2,325 on the hourly chart of ETH/USD. However, Ethereum is still above $2,300 and the 100-hourly Simple Moving Average.
Source: ETHUSD on TradingView.com
On the upside, the first major resistance is near the $2,325 level. The next major resistance is near $2,350, above which the price might rise and test the $2,400 resistance. If the bulls push the price above the $2,400 resistance, they could aim for $2,450. A clear move above the $2,450 level might send the price further higher. In the stated case, the price could rise toward the $2,550 level.
More Losses in ETH?If Ethereum fails to clear the $2,325 resistance, it could continue to move down. Initial support on the downside is near the $2,300 level and the 100 hourly SMA.
The next key support could be the $2,295 zone or the 61.8% Fib retracement level of the upward move from the $2,235 swing low to the $2,390 high. A daily close below the $2,295 support might start another steady decline. In the stated case, Ether could test the $2,200 support. Any more losses might send the price toward the $2,120 level.
Technical Indicators
Hourly MACD – The MACD for ETH/USD is gaining momentum in the bearish zone.
Hourly RSI – The RSI for ETH/USD is now below the 50 level.
Major Support Level – $2,300
Major Resistance Level – $2,325
Original source
Read on NewsBTCRelated market context

Ethereum Price Prediction: ETH is Still Below Its 200 Week SMA, and Tom Lee Buying Spree Might End Soon
Ethereum price is trading above $1,700 after running for 5% today, and even our prediction model is calling for more leg higher. H...

Bitcoin Stabilizes Near Key Zone, But Glassnode Warns Capital Flows Remain Weak
Bitcoin’s rebound from the $60,000 area has given bulls something to work with, but Glassnode’s latest market read suggests the re...

Ethereum News: Last Chance to Buy Ethereum Under $2K? ETH USD Powers Up After Hormuz Peace Deal
In the latest Ethereum News, Ethereum ETH Price is trading at $1,739 up 4% in 24 hours, as risk assets catch a bid following the H...

BTC News Today: Bitcoin Climbs Toward $66K as Trump Reveals US-Iran Peace Deal
The renewed geopolitical optimism helped improve risk sentiment across financial markets, pushing Bitcoin back toward the $66,000...

Ethereum Research Proposal Targets Post-Quantum Wallet Security At Low Gas Cost
A new Ethereum Research proposal is putting post-quantum wallet security back in focus, outlining a practical way to verify quantu...

XRP Price Prediction: US-Iran Peace Deal Fuels 13% XRP Surge, Analysts Target $1.94 Retest
The latest move saw XRP price today reclaim the $1.28 level for the first time in nearly two weeks. Market participants pointed to...