Ethereum Price Turns Green But Decreasing Volumes Might Be Concerning
Ethereum extended its increase above the $1,300 resistance zone against the US Dollar. ETH tested the $1,350 zone and is currently correcting lower. Ethereum remained in a positive zone and climbed above the $1,300 and $...

Ethereum extended its increase above the $1,300 resistance zone against the US Dollar. ETH tested the $1,350 zone and is currently correcting lower.
- Ethereum remained in a positive zone and climbed above the $1,300 and $1,320 resistance levels.
- The price is now trading above $1,300 and the 100 hourly simple moving average.
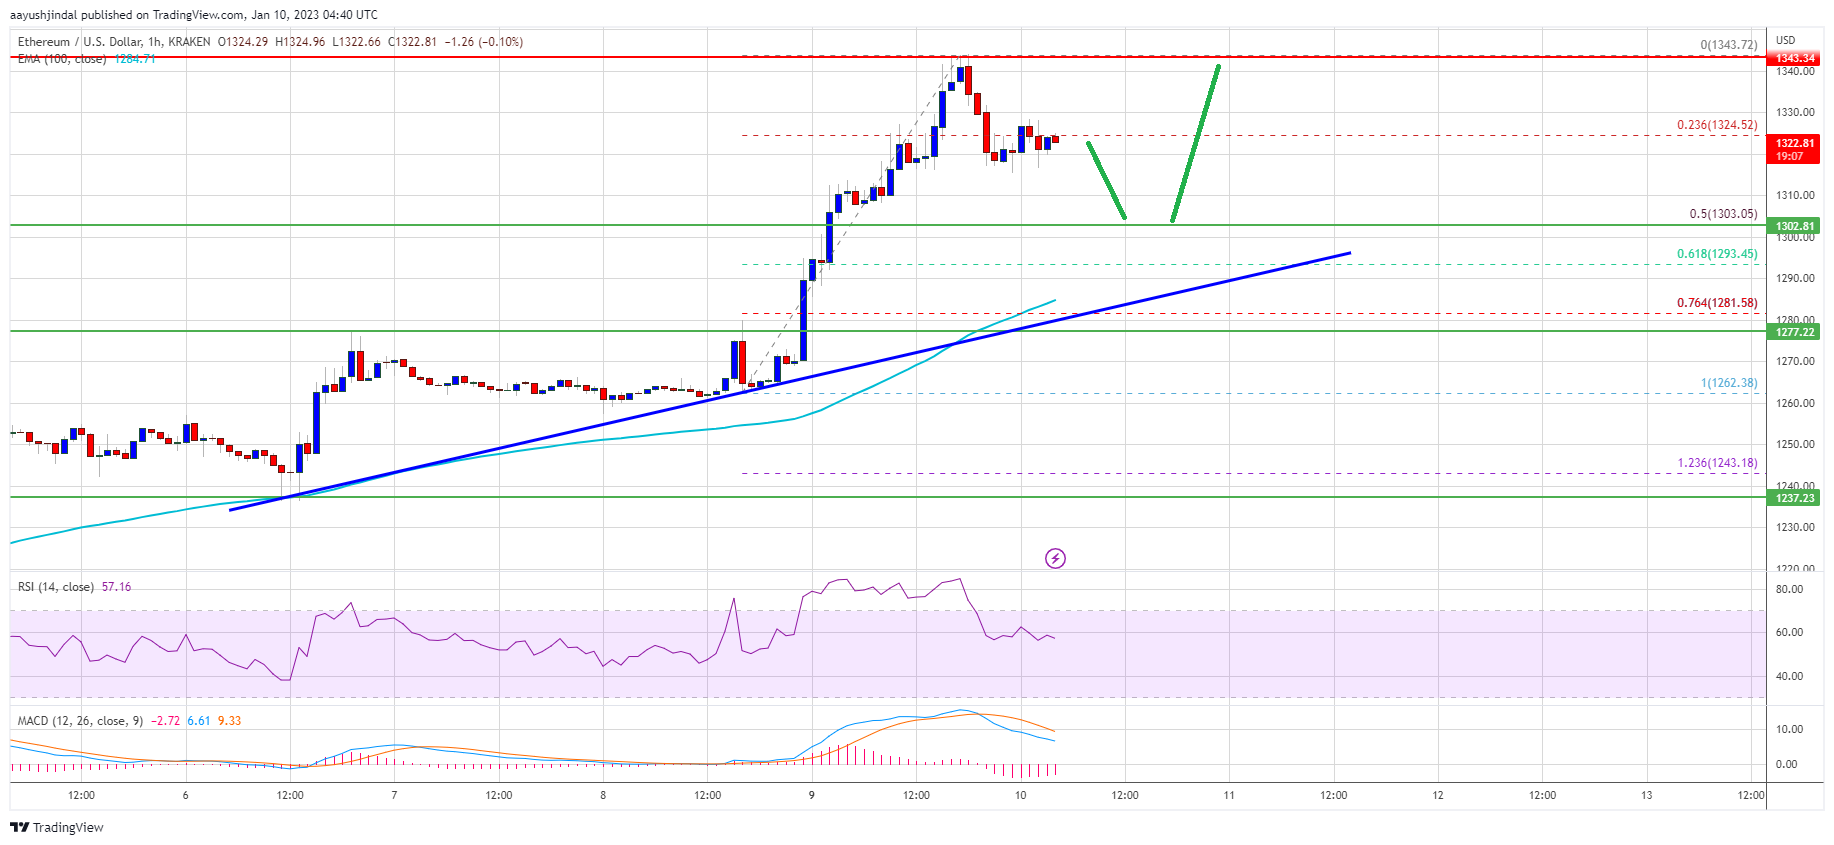
- There is a major bullish trend line forming with support near $1,292 on the hourly chart of ETH/USD (data feed via Kraken).
- The pair could rise further if it stays above the $1,280 support zone.
Ethereum price started a decent increase above the $1,280 level. ETH gained pace and was able to clear the $1,300 resistance zone to move into a positive zone, similar to bitcoin above $17,000.
The price even broke the $1,320 zone to extend its increase. Ether traded to a new yearly high at $1,343 and slowly lost momentum. It seems like the price climbed above the $1,320 level on a decreasing trading volume. As a result, there was a pullback below the $1,325 level.
The price declined below the 23.6% Fib retracement level of the upward move from the $1,262 swing low to $1,343 high. Ether is still trading above $1,300 and the 100 hourly simple moving average.
There is also a major bullish trend line forming with support near $1,292 on the hourly chart of ETH/USD. An immediate resistance is near the $1,330 level. The next major resistance is near the $1,350 level. A clear move above the $1,350 resistance could another decent increase.
Source: ETHUSD on TradingView.com
In the stated case, the price may perhaps climb higher towards the $1,400 resistance. The next major resistance could be $1,450, above which the price could surge towards the $1,500 resistance zone.
Dips Supported in ETH?If ethereum fails to clear the $1,330 resistance, it could continue to move lower. An initial support on the downside is near the $1,305 level.
The next major support is near the $1,292 level and the trend line. It is near the 61.8% Fib retracement level of the upward move from the $1,262 swing low to $1,343 high. A downside break below the trend line support might call for a move towards the $1,280 support. Any more losses might call for a test of the $1,250 zone.
Technical Indicators
Hourly MACD – The MACD for ETH/USD is now losing momentum in the bullish zone.
Hourly RSI – The RSI for ETH/USD is now above the 50 level.
Major Support Level – $1,280
Major Resistance Level – $1,350
Original source
Read on NewsBTCRelated market context

Standard Chartered Says Bitcoin Bottomed Near $59,000 As Crypto Winter Ends
TL;DR Standard Chartered’s Geoffrey Kendrick reportedly says Bitcoin’s $59,000 area marked the cycle bottom. The note cites SpaceX...

Google Gemini AI Predicts Jaw-Dropping XRP Price For Next 90 Days
Google Gemini AI just put XRP back under the spotlight, predicting it is tightly wound for a major breakout toward $1.60 to $1.80...

Bitcoin price challenges $64,000 weekend wall – needing a breakout or risk a deeper correction
Bitcoin reclaimed $64,000 on June 12 and touched an intraday high of $64,301 in the same session that spot ETF flows finally flipp...

Elon Musk SpaceX AI Predicts Incredible Bitcoin Price For Next 30 Days
Here is the thing about capitulation calls. They only sound smart in hindsight. Right now, with Bitcoin price scraping along the l...

Bitcoin rises above $64,000 after Pakistan prime minister says Iran peace deal is near
Bitcoin traded above $64,000 on Saturday, supported by its strongest ETF inflows in a month and growing optimism around geopolitic...

Bitcoin price faces new risk as big buyers lose conviction
Bitcoin’s largest buyers are no longer behaving like a reliable backstop for the largest cryptocurrency. The exchange-traded funds...