Ethereum Price Turns Lower: Can ETH Bounce Back From $2,550?
Ethereum price started a pullback from the $2,680 resistance. ETH is now declining and remains at risk of more downsides if it fails to stay above $2,550. Ethereum started a fresh decline below the $2,650 level. The pric...

Ethereum price started a pullback from the $2,680 resistance. ETH is now declining and remains at risk of more downsides if it fails to stay above $2,550.
- Ethereum started a fresh decline below the $2,650 level.
- The price is trading below $2,680 and the 100-hourly Simple Moving Average.
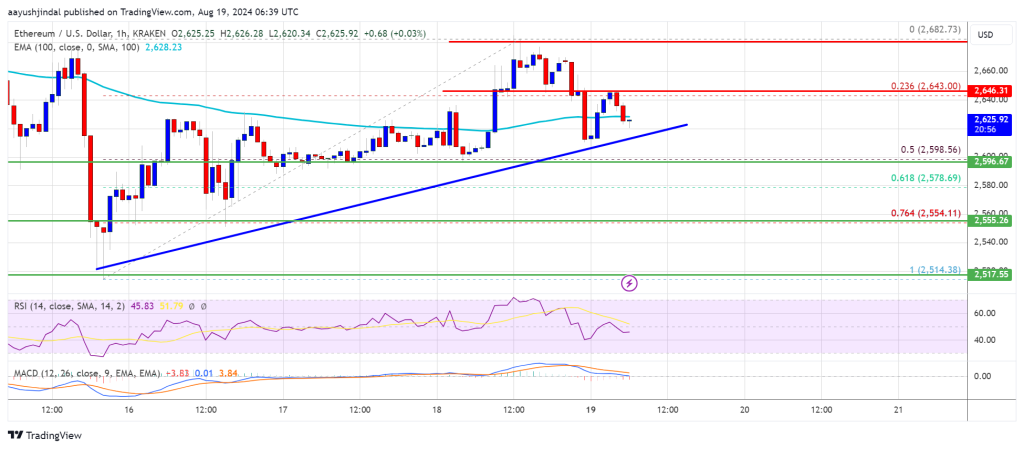
- There is a key bullish trend line forming with support at $2,610 on the hourly chart of ETH/USD (data feed via Kraken).
- The pair could extend losses if it drops below the $2,550 support zone.
Ethereum price attempted to gain pace for a move above the $2,680 level. However, ETH failed to continue higher and started a fresh decline below $2,650 like Bitcoin.
There was a break below the 23.6% Fib retracement level of the upward move from the $2,514 swing low to the $2,682 high. The price even slipped below the 100-hourly Simple Moving Average. However, the bulls are now active near the $2,620 level.
Ethereum price is now trading below $2,650 and the 100-hourly Simple Moving Average. There is also a key bullish trend line forming with support at $2,610 on the hourly chart of ETH/USD.
If there is another increase, the price might face hurdles near the $2,650 level. The first major resistance is near the $2,680 level. A close above the $2,680 level might send Ether toward the $2,720 resistance. The next key resistance is near $2,720. An upside break above the $2,720 resistance might send the price higher toward the $2,880 resistance zone in the near term.
More Losses In ETH?If Ethereum fails to clear the $2,680 resistance, it could continue to move down. Initial support on the downside is near $2,620. The first major support sits near the $2,600 zone or the 50% Fib retracement level of the upward move from the $2,514 swing low to the $2,682 high.
A clear move below the $2,600 support might push the price toward $2,550 where the bulls could emerge. Any more losses might send the price toward the $2,500 support level in the near term. The next key support sits at $2,440.
Technical Indicators
Hourly MACD – The MACD for ETH/USD is gaining momentum in the bearish zone.
Hourly RSI – The RSI for ETH/USD is now below the 50 zone.
Major Support Level – $2,600
Major Resistance Level – $2,680
Original source
Read on NewsBTCRelated market context

Uranium Holds Above $85 as Mining ETF Rebounds From June Sell-Off
The latest charts display that the market is divided into stable physical prices and uranium shares trying to regain momentum afte...

Tether USDT Briefly Overtakes Ethereum in Market Cap: A $187B Wake-Up Call
For a few hours, earlier this week, Tether USDT stablecoin held a higher market cap than Ethereum, the first time that has happene...

Standard Chartered Says Bitcoin Bottomed Near $59,000 As Crypto Winter Ends
TL;DR Standard Chartered’s Geoffrey Kendrick reportedly says Bitcoin’s $59,000 area marked the cycle bottom. The note cites SpaceX...

Elon Musk SpaceX AI Predicts Incredible Bitcoin Price For Next 30 Days
Here is the thing about capitulation calls. They only sound smart in hindsight. Right now, with Bitcoin price scraping along the l...

Elon Musk’s trillionaire status puts his net worth above crypto’s entire market cap outside Bitcoin
Elon Musk has become the first person in modern history to amass a personal net worth exceeding $1 trillion, crossing the historic...

Crypto Today: Bitcoin ETF Rumours, Ethereum Strength, and Mining Heat for Canadian Homes
Bitcoin ETF rumours lift sentiment, Ethereum recaptures $3,800, and North Vancouver uses mining heat for homes. Coinbase unveils p...