Ethereum Price Weakens: Can It Defend the $2,500 Level?
Ethereum price started a downside correction from the $2,700 zone. ETH is now consolidating and struggling to stay above the $2,500 support. Ethereum started a downside correction below the $2,650 and $2,620 levels. The...

Ethereum price started a downside correction from the $2,700 zone. ETH is now consolidating and struggling to stay above the $2,500 support.
- Ethereum started a downside correction below the $2,650 and $2,620 levels.
- The price is trading below $2,650 and the 100-hourly Simple Moving Average.
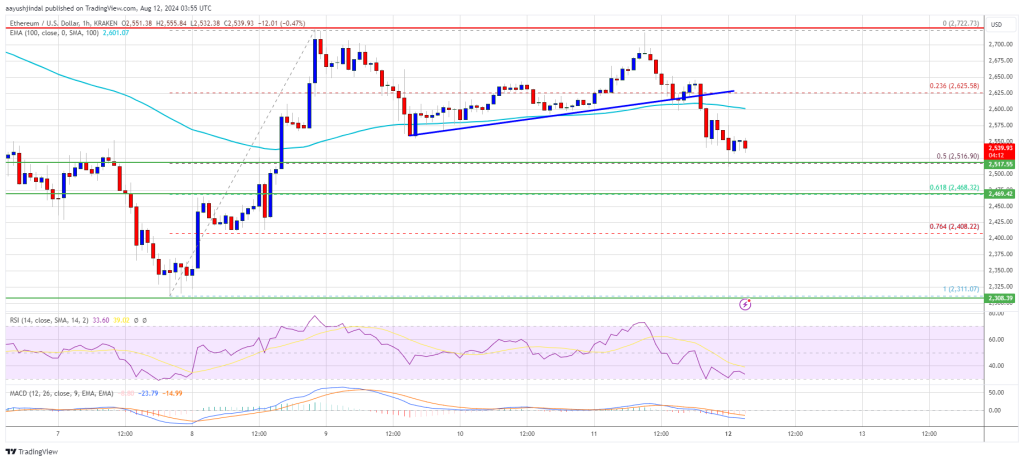
- There was a break below a connecting bullish trend line with support at $2,620 on the hourly chart of ETH/USD (data feed via Kraken).
- The pair could rise again if it stays above the $2,550 support zone.
Ethereum price struggled to extend gains above the $2,700 resistance zone. ETH started a downside correction below the $2,650 level like Bitcoin. There was a move below the $2,620 and $2,600 levels.
The price declined below the 23.6% Fib retracement level of the upward move from the $2,311 swing low to the $2,722 high. Besides, there was a break below a connecting bullish trend line with support at $2,620 on the hourly chart of ETH/USD.
Ethereum price is now trading below $2,650 and the 100-hourly Simple Moving Average. However, the bulls are trying to protect more downsides below the $2,500 support zone.
If there is another increase, the price might face hurdles near the $2,600 level and the 100-hourly Simple Moving Average. The first major resistance is near the $2,625 level. A close above the $2,625 level might send Ether toward the $2,700 resistance.
The next key resistance is near $2,720. An upside break above the $2,720 resistance might send the price higher toward the $2,880 resistance zone in the near term.
More Downsides In ETH?If Ethereum fails to clear the $2,625 resistance, it could continue to move down. Initial support on the downside is near $2,520 and the 50% Fib retracement level of the upward move from the $2,311 swing low to the $2,722 high. The first major support sits near the $2,500 zone.
A clear move below the $2,500 support might push the price toward $2,450. Any more losses might send the price toward the $2,320 support level in the near term. The next key support sits at $2,250.
Technical Indicators
Hourly MACD – The MACD for ETH/USD is gaining momentum in the bearish zone.
Hourly RSI – The RSI for ETH/USD is now below the 50 zone.
Major Support Level – $2,500
Major Resistance Level – $2,625
Original source
Read on NewsBTCRelated market context

Uranium Holds Above $85 as Mining ETF Rebounds From June Sell-Off
The latest charts display that the market is divided into stable physical prices and uranium shares trying to regain momentum afte...

Standard Chartered Says Bitcoin Bottomed Near $59,000 As Crypto Winter Ends
TL;DR Standard Chartered’s Geoffrey Kendrick reportedly says Bitcoin’s $59,000 area marked the cycle bottom. The note cites SpaceX...

Elon Musk SpaceX AI Predicts Incredible Bitcoin Price For Next 30 Days
Here is the thing about capitulation calls. They only sound smart in hindsight. Right now, with Bitcoin price scraping along the l...

Bitcoin price challenges $64,000 weekend wall – needing a breakout or risk a deeper correction
Bitcoin reclaimed $64,000 on June 12 and touched an intraday high of $64,301 in the same session that spot ETF flows finally flipp...

Bitcoin rises above $64,000 after Pakistan prime minister says Iran peace deal is near
Bitcoin traded above $64,000 on Saturday, supported by its strongest ETF inflows in a month and growing optimism around geopolitic...

US forces shoot down Iranian attack drones near Strait of Hormuz, Bitcoin drops below $73K
Geopolitical tensions near vital oil routes can destabilize financial markets, highlighting the interconnectedness of global secur...