Ethereum retakes 10% market share, but ETH bulls shouldn't celebrate yet
Key takeaways:Ethereum’s market dominance has hit overbought RSI levels not seen since May 2021, historically followed by major pullbacks.ETH/USD is showing a bearish divergence on the four-hour chart, hinting at a poten...
Archive context
Older archive item. Useful for background and entity history, but not a fresh market-moving signal.

Key takeaways:
Ethereum’s market dominance has hit overbought RSI levels not seen since May 2021, historically followed by major pullbacks.
ETH/USD is showing a bearish divergence on the four-hour chart, hinting at a potential 10–15% price correction.
Despite the near-term risks, some analysts view a pullback as a “buy-the-dip” setup before a possible move toward $3,500–$3,800.
Ether (ETH) has surged over 50% month-to-date in May, vastly outperforming the broader crypto market’s 15.25% gain. The rally has pushed Ethereum’s market dominance (ETH.D) toward the critical 10% threshold for the first time since March.
But the rising dominance accompanies signs of overheating, indicating that Ethereum bulls should not celebrate the rally just yet.
Ether’s RSI most overextended since May 2021The strong recovery in Ethereum’s crypto market share has pushed its daily relative strength index (RSI) to its most overbought zone since May 2021, raising red flags for traders betting on further upside, at least in the short term.
Historically, such extreme RSI levels on ETH.D have marked the beginning of major pullbacks. One notable instance occurred in early July 2024, when ETH dominance peaked near similar RSI levels.
ETH.D daily performance chart. Source: TradingViewOver the following 315 days, ETH.D dropped by more than 17.5%. The current RSI spike, again above 80, mimics a similar setup, suggesting that Ethereum could be nearing a local top in its market share.
Adding to the bearish outlook, ETH.D remains below its 200-day exponential moving average (200-day EMA; the blue wave). This resistance level has repeatedly capped Ethereum’s dominance during previous recovery attempts.
Previous overbought pullbacks have initially pushed Ethereum’s market share toward its 50-day EMA (the red wave).
The ETH.D metric, therefore, risks declining toward its current 50-day EMA support at around 8.24% by June, suggesting potential capital rotation out of Ethereum markets to other coins in the coming weeks.
Bearish divergence signals 15% ETH price dropOn the four-hour ETH/USD chart, a classic bearish divergence is emerging, where Ethereum’s price continues to print higher highs, but momentum indicators trend lower.
Crypto trader AlphaBTC noted that ETH is showing “three clear drives of divergence,” a setup often preceding trend exhaustion. He added that key Fibonacci levels align with potential support zones, suggesting a pullback could be imminent.
ETH/USD four-hour price chart. Source: AlphaBTCWith ETH hovering near the $2,740 Fibonacci extension, profit-taking pressure may intensify, opening the door for a short-term correction toward lower Fib levels at around $2,330 or even $2,190, down 10%-15% from the current prices.
Independent market analyst Michaël van de Poppe suggests ETH’s decline in the coming weeks could serve as a “buy-the-dip opportunity,” indicating that the cryptocurrency would eventually climb over $3,500.
Related: Altcoins’ roaring returns and falling USDT stablecoin dominance suggest ‘altseason’ is here
Veteran trader Peter Brandt further predicts a “moon shot” rally to over $3,800.
This article does not contain investment advice or recommendations. Every investment and trading move involves risk, and readers should conduct their own research when making a decision.
Why this matters
This ethereum story adds another data point to the current market tape and is useful when read alongside nearby source coverage.
Original source
Read on CointelegraphRelated market context

ETH USD Loses Ground as Ethereum Price Analysis Remains Targeting $3,000 This Week
Ethereum Price Prediction, September 23: Ethereum (ETH) trades at $2,735, down a marginal 0.61% over the past 24 hours, a pause, n...

Bitcoin Recoils Below $86,000: Is Bitcoin Price Prediction Still Shooting For $90,000?
Bitcoin Price Prediction: Bitcoin (BTC) trades at $85,954, down a modest 0.3% on the day, holding the upper band of a rebound that...
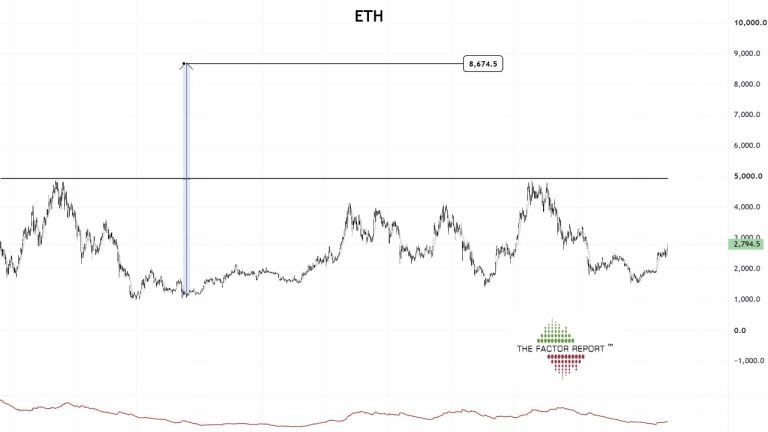
Peter Brandt Sees Ethereum at $8,600 if ETH Clears $5,000
Ethereum could eventually reach $8,600 if it first clears $5,000, according to a long-term chart posted by veteran trader Peter Br...

Can Ripple Crack $1.80? XRP Price Prediction Says This Week
XRP Price Prediction: Ripple (XRP) trades at $1.59 as of this writing, up 1.6% on the day, with a 24-hour range spanning $1.5577 t...

Solana flips Ethereum in fees, while ETH holds the burn lead
Solana generated more user fees than Ethereum in data provider DefiLlama's Sept. 22 dashboard snapshot, while Ethereum burned more...

Cloudflare’s Will Papper suggests Ethereum’s sharding design could enable scalable stablecoin payments
Cloudflare's adoption of Ethereum's sharding design for scalable stablecoin payments could revolutionize machine-to-machine transa...