Ethereum Risks Slide To $2,000 If December Closes Below This Level: Analyst
A cryptocurrency analyst has explained where Ethereum could go next based on a long-term Parallel Channel forming in its monthly price chart. Ethereum Has Been Trading Inside A Parallel Channel For The Last Few Years In...
Archive context
Older archive item. Useful for background and entity history, but not a fresh market-moving signal.

A cryptocurrency analyst has explained where Ethereum could go next based on a long-term Parallel Channel forming in its monthly price chart.
Ethereum Has Been Trading Inside A Parallel Channel For The Last Few YearsIn a new post on X, analyst Ali Martinez has talked about a long-term pattern that Ethereum has appeared to have been following for the last few years. The pattern in question is a “Parallel Channel” from technical analysis (TA), which forms whenever an asset’s price trades between two parallel trendlines.
The upper level of a Parallel Channel is likely to facilitate top formations in the asset, while the lower one can act as a support boundary and allow the price to remain above it.
Parallel Channels can be of a few different types depending on how the lines are oriented with respect to the graph axes. If the channel has some slope, it falls into either the Ascending or Descending categories. Naturally, it’s the former when the lines are angled upward and latter when they are downward.
In the context of the current topic, the simplest type of Parallel Channel is of relevance: a channel that has zero slope. That is, a pattern with lines that are parallel to the time-axis. As an asset trades inside such a channel, it experiences consolidation in an exactly sideways manner.
If one of the levels of the pattern break, a sustained continuation of trend may occur in that direction. This means that a surge above the resistance can be a bullish signal, while a fall under support a bearish one.
Now, here is the chart shared by Martinez that shows the Parallel Channel that the monthly price of Ethereum has been trading inside for the last few years:
As displayed in the above graph, the recent bearish wave in Ethereum has meant that its 1-month price has retraced to the midway line of the Parallel Channel located at $2,930.
Martinez has noted that if ETH closes December below this level, a decline to lower levels could occur. The next potential support is situated at $2,000, corresponding to the 25% mark of the Parallel Channel. The cryptocurrency found support around this line in the starting months of 2025.
In the scenario that this level also fails, Ethereum may be looking at a fall to the bottom line of the Parallel Channel at $1,090. The asset last retested it back in 2022 and successfully found support.
It now remains to be seen how ETH will close out the month and whether one of the next two levels of the pattern will come into play.
ETH PriceAt the time of writing, Ethereum is floating around $2,860, down over 15% in the last seven days.
Why this matters
This ethereum story adds another data point to the current market tape and is useful when read alongside nearby source coverage.
Original source
Read on NewsBTCRelated market context

Thailand wants a piece of the $120 billion Bitcoin and Ethereum ETF market, but on its own terms
Thailand has finalized rules allowing domestic Bitcoin and Ethereum ETFs while restricting retail access to competing overseas inv...

Bitcoin Extends Slide — Can ‘Uptober’ 2026 Beat Last Year’s?
Bitcoin Magazine Bitcoin Extends Slide — Can ‘Uptober’ 2026 Beat Last Year’s? Bitcoin’s price dipped further on Monday, sliding 2%...

XRP’s next Wall Street expansion comes with an unexpected complication from Ripple
Evernorth is preparing to begin trading on Nasdaq on Monday, bringing approximately 473 million XRP into a publicly traded treasur...

Anthropic’s Claude AI Predicts a Wild Price for Chainlink (LINK)
Anthropic’s Claude AI predicts that in a peak bull-market setup, Chainlink (LINK) could hit $150–$250 by January 1, 2027, with a s...

Meta AI Predicts 7-Figure BTC in 2026, But How?
Mark Zuckerberg’s Meta AI predicts that if a full-blown crypto bull market returns in Q4 and a landmark catalyst turbocharges it,...
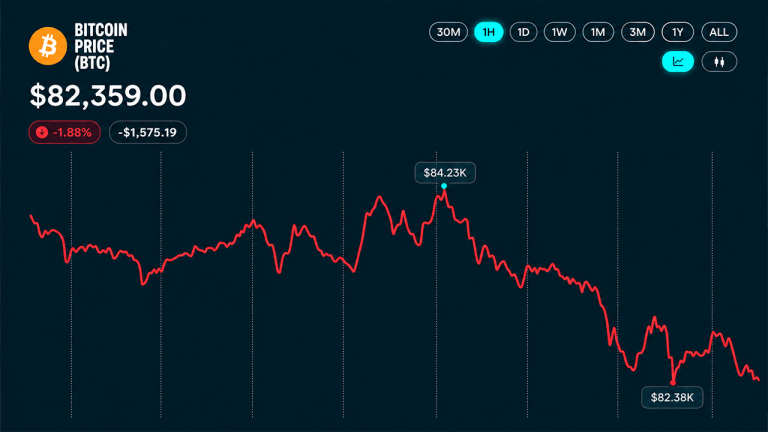
Bitcoin Price Faces CPI Reckoning as Analysts Eye $81,300 Support
Bitcoin’s price is hovering near $82,400 on Monday afternoon as Wall Street delivers a mixed performance across major indexes. Inv...