Ethereum To Match Bitcoin’s Strength and Surge? Indicators Turn Green
Ethereum price started a decent upward move from the $3,080 support zone. ETH is recovering and might aim for a test of the $3,500 resistance zone. Ethereum is showing positive signs from the $3,150 pivot zone. The price...
Archive context
Older archive item. Useful for background and entity history, but not a fresh market-moving signal.

Ethereum price started a decent upward move from the $3,080 support zone. ETH is recovering and might aim for a test of the $3,500 resistance zone.
- Ethereum is showing positive signs from the $3,150 pivot zone.
- The price is trading above $3,250 and the 100-hourly Simple Moving Average.
- There was a break above a key bearish trend line with resistance at $3,280 on the hourly chart of ETH/USD (data feed via Kraken).
- The pair could continue to move up if it stays above the $3,280 support zone.
Ethereum price formed a base above the $3,080 support zone. A low is formed at $3,087 and the price started a decent increase above the $3,220 resistance zone, but lagged strength like Bitcoin.
There was a break above a key bearish trend line with resistance at $3,280 on the hourly chart of ETH/USD. The pair was able to clear the 50% Fib retracement level of the downward move from the $3,540 swing high to the $3,087 low.
Ethereum is now trading above $3,250 and the 100-hourly Simple Moving Average. If there are more upsides, the price could face resistance near the $3,375 level or the 61.8% Fib retracement level of the downward move from the $3,540 swing high to the $3,087 low.
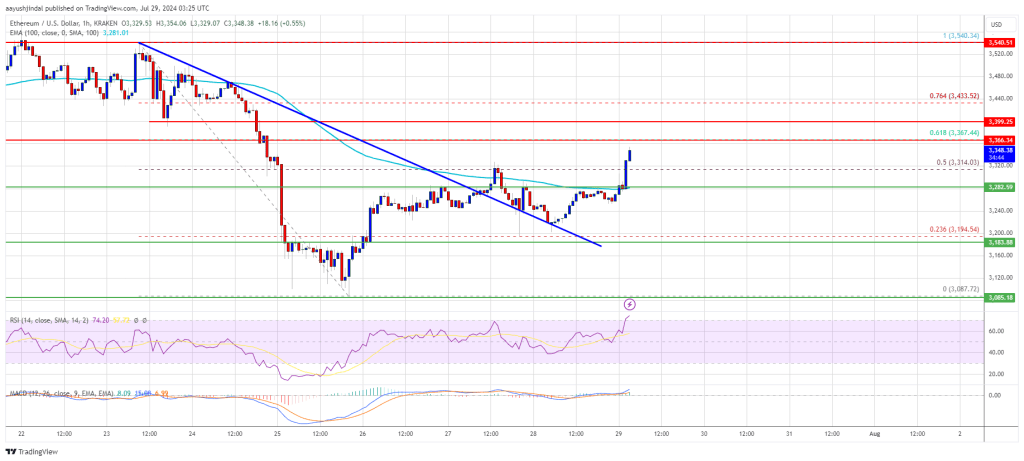
The first major resistance is near the $3,400 level. The next major hurdle is near the $3,450 level. A close above the $3,450 level might send Ether toward the $3,500 resistance. The next key resistance is near $3,550. An upside break above the $3,550 resistance might send the price higher toward the $3,720 resistance zone in the coming days.
Are Dips Limited In ETH?If Ethereum fails to clear the $3,400 resistance, it could start a downside correction. Initial support on the downside is near $3,280. The first major support sits near the $3,250 zone.
A clear move below the $3,180 support might push the price toward $3,120. Any more losses might send the price toward the $3,080 support level in the near term. The next key support sits at $3,050.
Technical Indicators
Hourly MACD – The MACD for ETH/USD is gaining momentum in the bullish zone.
Hourly RSI – The RSI for ETH/USD is now above the 50 zone.
Major Support Level – $3,250
Major Resistance Level – $3,400
Why this matters
This ethereum story adds another data point to the current market tape and is useful when read alongside nearby source coverage.
Original source
Read on NewsBTCRelated market context

Ethereum (ETH) Price Prediction: Bulls and Bears Face Off as $3,000 Rally Meets Liquidation Risk
Ethereum price is entering a volatile phase after its latest recovery, with buyers trying to defend the recent breakout while sell...

Microsoft Copilot AI Predicts Bitcoin Will Do Something Incredible in Q4 2026
Microsoft Copilot AI predicts a wild move for BTC in Q4 2026, calling it one of the strongest asymmetric risk-reward positions ava...

Crypto News Today: XRP, Dogecoin Signal Long-Term MVRV Discounts as Bitcoin Holds $82.5K Neckline
On-chain analytics firm Santiment reported that XRP’s 365-day Market Value to Realized Value (MVRV) stood at approximately -11.75%...

Nearly $352M Moved From Crypto Exchange Bitget Wallets in Suspected Hack
Bitcoin Magazine Nearly $352M Moved From Crypto Exchange Bitget Wallets in Suspected Hack An estimated $351.6 million in crypto ha...

XRP Price Under Pressure: Spot Selling Overwhelms ETF Demand
XRP price is hovering at the $1.50 level, down 8% over the prior 24 hours after failing to hold the $1.60 level. The drop happens...

Crypto’s bear market wiped out over $2 trillion, yet on-chain activity held above $9 trillion
The crypto industry lost $2.1 trillion in market value during the past year, yet measured on-chain economic activity declined just...