Ethereum To See Fresh Move Soon? What Futures Data Says
Data shows the Ethereum Open Interest has been trading at relatively low levels recently. Here’s what this could mean for the asset’s price. Ethereum Open Interest Has Been Moving Sideways Since Its Plunge As explained b...
Archive context
Older archive item. Useful for background and entity history, but not a fresh market-moving signal.
Data shows the Ethereum Open Interest has been trading at relatively low levels recently. Here’s what this could mean for the asset’s price.
Ethereum Open Interest Has Been Moving Sideways Since Its PlungeAs explained by an analyst in a CryptoQuant Quicktake post, the ETH Open Interest has followed a similar trajectory as the price of the cryptocurrency recently. The “Open Interest” here refers to the total number of derivative-related contracts open for Ethereum on all exchanges.
When the value of this metric goes up, it means that investors are currently opening up new positions on these platforms. Generally, this kind of trend leads to an increase in the market’s total leverage, so the asset price could become more volatile.
On the other hand, a decline in the indicator implies the investors are either closing up their positions of their own volition or getting forcibly liquidated by their platform. Such a drawdown may accompany violent price action, but once the drop is over, the market could become more stable due to the reduced leverage.
Now, here is a chart that shows the trend in the Ethereum Open Interest over the last few months:
As displayed in the above graph, the Ethereum Open Interest registered a sharp drop earlier alongside the asset’s price. The plunge in the metric was naturally caused by the long contract holders being washed out in the price drawdown.
As the price has mostly consolidated sideways since the decline, so has the value of the Open Interest. The quant notes,
This alignment suggests a cooling down of activity within the futures market. Consequently, the market appears poised for the resurgence of either long or short positions, potentially initiating a fresh and decisive market movement in either direction.
Another indicator related to the derivative market that could be relevant for Ethereum’s future price action is the funding rate. This metric tracks the periodic fees that derivative contract holders are currently paying each other.
Positive funding rates imply that the long holders are paying the shorts a premium to hold onto their positions; hence, that bullish sentiment is dominant. Similarly, negative values suggest that a bearish sentiment is shared by the majority of the derivative traders.
The chart below shows that the Ethereum funding rate has recently turned red.
Historically, the market has been more likely to move against the opinion of the majority, so the fact that the funding rate has flipped negative may be a good sign for the chances of any potential uptrends to start.
ETH PriceEthereum has gradually increased over the last few days, as its price has now reached $3,200.
Why this matters
This ethereum story adds another data point to the current market tape and is useful when read alongside nearby source coverage.
Original source
Read on NewsBTCRelated market context

Elon Musk Grok AI Predicts a Bold Move for Ethereum in 2026
When prompted, the Elon Musk-backed Grok AI predicts a bold move for Ethereum (ETH) over the remainder of 2026. It claims that if...

ARK partners with Securitize to put a venture fund on Ethereum, but leaves exit doors locked
ARK Invest and Securitize announced on Sept. 24 that eligible investors would be able to hold tokenized interests in the ARK Ventu...

Washington has $114 billion reasons to want Tether around
Not that long ago, Washington fined Tether for misleading people about the dollars behind its tokens. Today, the company's insatia...
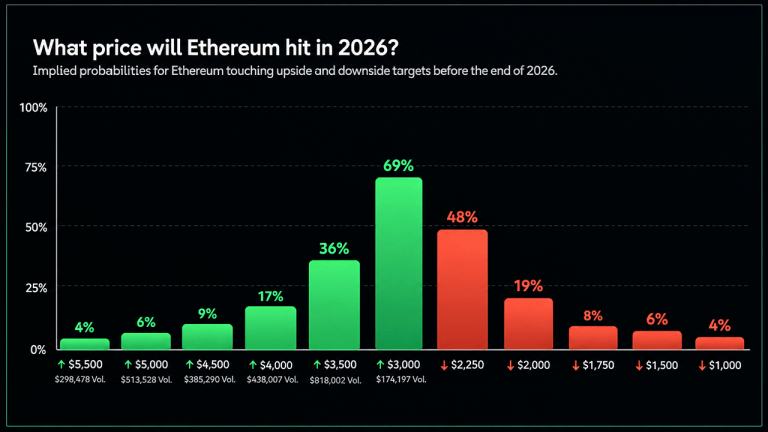
Ethereum, Solana and Zcash Face Wild Year-End Price Predictions
Three cryptocurrencies, three very different bets and millions of dollars riding on what happens before New Year’s Day. Prediction...

PeerDAS has operated successfully for nearly a year on Ethereum
PeerDAS enhances Ethereum's scalability and decentralization, reducing transaction costs and enabling broader participation withou...

Ethereum node sync improved to under half a day with EIP-4444 optimizations
EIP-4444's optimizations enhance Ethereum's accessibility, reducing entry barriers for node operators and promoting network decent...