Ethereum Treasury Boom Drives Demand: Can The Market Handle The Risks?
Ethereum is undergoing a correction after weeks of strong momentum, but institutional adoption is quietly reshaping the market’s long-term dynamics. According to CryptoQuant, the popular “Crypto Treasury Strategy,” long...
Archive context
Older archive item. Useful for background and entity history, but not a fresh market-moving signal.

Ethereum is undergoing a correction after weeks of strong momentum, but institutional adoption is quietly reshaping the market’s long-term dynamics. According to CryptoQuant, the popular “Crypto Treasury Strategy,” long associated with Bitcoin, has now entered the Ethereum ecosystem. Over 16 companies have already adopted this approach, collectively holding 2,455,943 ETH worth nearly $11.0 billion. This significant allocation has effectively locked away a sizable portion of ETH, reducing available supply on the open market.
The treasury movement mirrors Bitcoin’s playbook, where corporations strategically accumulated BTC as a reserve asset. However, Ethereum presents important differences. Unlike Bitcoin’s hard-capped supply of 21 million, ETH has no fixed maximum. Instead, its supply dynamics are shaped by network activity and the burn mechanism introduced with EIP-1559. While these mechanics can create deflationary periods, Ethereum’s total supply still increased by about 1 million ETH (~0.9%) over the last year.
This duality presents both opportunity and risk. On one hand, institutional holdings reduce liquid supply and reinforce Ethereum’s role as a strategic asset. On the other hand, variable issuance means that during periods of low network activity, supply growth could accelerate, diluting scarcity effects. As Ethereum tests key demand levels, the treasury strategy may prove pivotal in shaping its next major trend.
Ethereum: Treasury Concentration And Leverage RisksAccording to CryptoQuant’s analysis, Ethereum’s recent treasury adoption trend carries both opportunities and risks. On one hand, institutional treasuries have locked away billions in ETH, reducing available supply on the market.
However, the structure of these holdings also presents concentration risks. For example, BitMine Immersion Technologies, which has openly stated its goal of controlling 5% of all ETH, currently holds just 0.7%. The next largest holder, SharpLink Gaming, manages only 0.6%. This means treasury adoption is still concentrated among a few players. If one or two large holders were to offload their reserves, the market could face sharp price shocks.
Beyond spot accumulation, leverage is another growing factor. CryptoQuant highlights that ETH futures open interest has climbed to around $38 billion. This level of leverage means that large swings in price can trigger cascading liquidations. In crypto markets, leverage is synonymous with volatility.
The fragility of this setup was evident on August 14, when a wipeout of just $2 billion in open interest led to $290 million in forced liquidations and a 7% drop in ETH’s price. This event underlines how quickly things can spiral when liquidity is thin and leverage is high. Spot selling alone isn’t driving volatility—leveraged positions magnify every move. In this context, Ethereum’s treasury adoption may secure long-term demand, but concentrated holdings and growing leverage remain key vulnerabilities.
ETH Testing Critical Liquidity LevelsEthereum’s price action on the 3-day chart shows that after rallying to a local high near $4,790, ETH entered a correction phase but remains well above key moving averages. Currently trading around $4,227, the price has retraced from its peak but is still holding the broader bullish structure.
The 50-day SMA ($2,687), 100-day SMA ($2,838), and 200-day SMA ($2,912) are all trending upward, reflecting strong underlying momentum. Importantly, ETH is trading significantly above these long-term averages, confirming that the bullish trend remains intact despite the pullback. The strong bounce from below $3,000 earlier in the summer marked a decisive reversal after months of consolidation, setting the foundation for the latest breakout.
If bulls manage to hold the $4,200–$4,100 support zone, ETH could retest resistance near $4,790 and potentially move into price discovery. Conversely, failure to maintain this level could see a retest of the $3,800–$3,600 range. The coming sessions will be critical in confirming whether Ethereum resumes its uptrend or enters a deeper correction.
Featured image from Dall-E, chart from TradingView
Why this matters
This ethereum story adds another data point to the current market tape and is useful when read alongside nearby source coverage.
Original source
Read on NewsBTCRelated market context
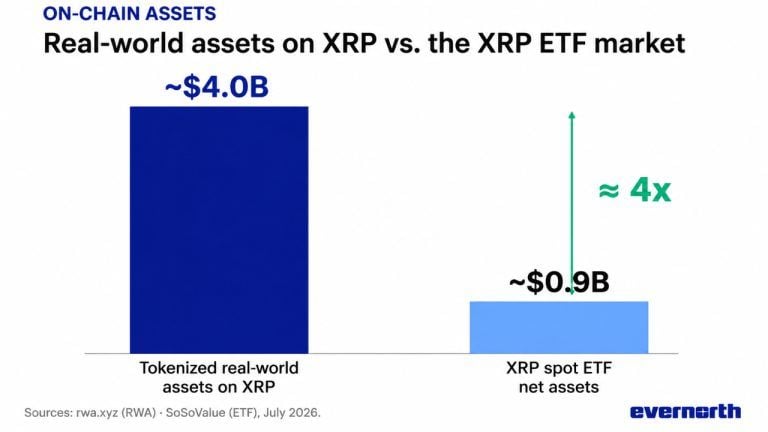
XRP Sees Triple Adoption Boost as Tokenized Assets Reach $4 Billion, ETF Demand Stays Strong
XRP is showing growth across multiple adoption metrics, with approximately $4 billion in tokenized real-world assets, continued sp...

Elon Musk Grok AI Predicts Incredible XRP Price Target by End of 2026
Elon Musk Grok AI just published what might be the most partnership-heavy XRP price prediction in this entire series. The model pr...

SpaceX Nasdaq-100 Entry Brings Bitcoin Exposure to Passive Index Investors
Bitcoin Magazine SpaceX Nasdaq-100 Entry Brings Bitcoin Exposure to Passive Index Investors Today (July 7, 2026) SpaceX formally j...

Bitcoin, Ethereum exchange supplies hit historic lows since 2017, 2015
Reduced exchange supplies of Bitcoin and Ethereum may lead to increased price pressures, reflecting a shift towards long-term hold...

Bitcoin price rebounds to $63K as leverage returns creating short term volatility risk
Bitcoin's rebound has cleared the first test: price recovered. The harder one starts now: proving buyers remain after the squeeze....

Bitmine acquires 40,000 Ethereum for $72M from FalconX and Kraken
Bitmine's aggressive ETH acquisition and staking strategy could tighten Ethereum's circulating supply, potentially impacting marke...