Ethereum Weekly Chart Nears Tower Top Formation As US Launches Attack On Iran – Details
Ethereum has officially broken below the long-standing range it had maintained since early May, losing the critical $2,320 support level. This breakdown was triggered by escalating geopolitical tensions, as news broke th...
Archive context
Older archive item. Useful for background and entity history, but not a fresh market-moving signal.

Ethereum has officially broken below the long-standing range it had maintained since early May, losing the critical $2,320 support level. This breakdown was triggered by escalating geopolitical tensions, as news broke that the United States had launched attacks on Iranian nuclear facilities. The announcement sent shockwaves through global markets, sparking widespread risk-off behavior and panic selling across crypto. Ethereum, already trading near the bottom of its six-week consolidation range, quickly reacted with a sharp drop, dragging the broader altcoin market with it.
The move marks a critical shift in sentiment, as Ethereum now trades outside the range that had served as a battleground between bulls and bears for over a month. With volatility spiking and confidence shaken, traders are re-evaluating risk in light of escalating conflict in the Middle East and broader macroeconomic headwinds.
According to top analyst Big Cheds, Ethereum’s weekly chart is now flirting with a potential tower top pattern completion — a bearish reversal structure that may signal further downside unless buyers reclaim key levels in the coming days. As the situation evolves, all eyes will remain on ETH’s ability to hold new support levels or risk further decline in a fragile market environment.
Ethereum Slides 22% From June Highs – All Eyes On Weekly StructureEthereum has lost over 22% of its value since peaking in early June, as global instability and heightened selling pressure weigh heavily on market sentiment. The asset has now broken below its six-week range, triggering concern among investors and adding to uncertainty across the broader crypto space. With rising tensions in the Middle East—particularly following US attacks on Iranian nuclear facilities—the market has entered a risk-off environment, dragging altcoins like Ethereum into deeper retracements.
Despite the volatility, Ethereum remains at the center of investor focus, as many still expect it to lead the next altseason. However, with bulls losing control of key support zones, confidence in a near-term rally continues to waver. Analysts are now split: while some predict a deeper retracement toward the $2,000 region, others argue that Ethereum is nearing exhaustion on the downside and may soon recover.
Big Cheds points to Ethereum’s weekly chart, where the price is currently flirting with a potential tower top pattern—a bearish reversal structure. If this pattern confirms, ETH may face another wave of downside before finding demand at lower supply levels.
If buyers step in during this pivotal moment, a recovery from this structure could quickly follow. The coming sessions will be critical in determining whether this breakdown extends or turns into a fakeout with bullish continuation. For now, traders should remain cautious, as Ethereum’s next move could define the tone of the altcoin market heading into July.
Ethereum Breaks Down Below Support As Volatility SpikesEthereum has officially broken below the $2,320 support level, signaling a shift in short-term market structure as shown in the 4-hour chart. After weeks of ranging between $2,320 and $2,650, ETH failed to reclaim its moving averages and lost bullish momentum. The price is now trading around $2,260, down sharply from its June highs near $2,900. This recent leg down follows a clean breakdown through the 50, 100, and 200-period SMAs, confirming a strong bearish momentum.
Volume spikes accompanied the drop, suggesting panic selling likely triggered by geopolitical turmoil in the Middle East. The price broke down aggressively with little resistance, meaning previous demand zones have now become weak. If buyers fail to step in quickly, Ethereum may revisit earlier May support levels around $2,100 or even $2,000.
From a technical standpoint, the breakdown invalidates the previous consolidation range, opening the door for a possible extended correction. Until ETH reclaims $2,320 and stabilizes above its moving averages, the risk of continued downside remains high. Market participants should watch closely for volume shifts or bullish divergences, but for now, Ethereum remains under pressure as uncertainty continues to dominate the macro environment. The next few sessions will be crucial for price discovery.
Featured image from Dall-E, chart from TradingView
Why this matters
This ethereum story adds another data point to the current market tape and is useful when read alongside nearby source coverage.
Original source
Read on NewsBTCRelated market context

ETH USD Loses Ground as Ethereum Price Analysis Remains Targeting $3,000 This Week
Ethereum Price Prediction, September 23: Ethereum (ETH) trades at $2,735, down a marginal 0.61% over the past 24 hours, a pause, n...

Bitcoin Recoils Below $86,000: Is Bitcoin Price Prediction Still Shooting For $90,000?
Bitcoin Price Prediction: Bitcoin (BTC) trades at $85,954, down a modest 0.3% on the day, holding the upper band of a rebound that...

Tron nears 100M weekly transactions, solidifying its role as stablecoin infrastructure
Tron's rise as a stablecoin hub could reshape global digital payments, offering low-cost transactions and influencing regulatory l...

Can Ripple Crack $1.80? XRP Price Prediction Says This Week
XRP Price Prediction: Ripple (XRP) trades at $1.59 as of this writing, up 1.6% on the day, with a 24-hour range spanning $1.5577 t...
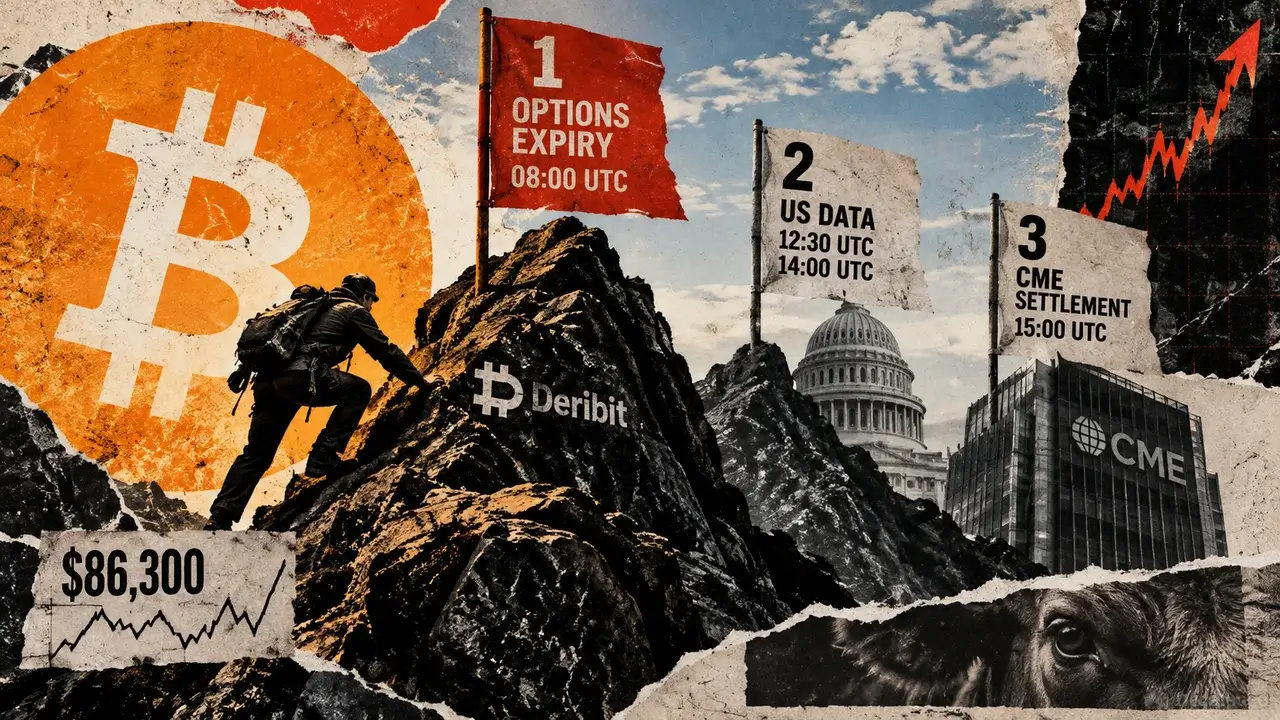
Bitcoin faces $16 billion options expiry Friday, then two more tests hit the rally
Bitcoin options carrying roughly $16 billion in notional value expire on Deribit at 08:00 UTC on Friday, Sept. 25. Calls account f...

Solana Price Prediction: Golden Cross and $2.97B Open Interest Put $400 Target in Focus
Solana price is trading near $117.38 after recovering strongly from its recent lows. With SOL now testing the crucial $118–$120 re...