Ethereum’s Leverage Reset Clears The Path For A Healthy Rebound – Analyst
Ethereum is attempting to push back above the $2,000 level as the broader crypto market navigates persistent uncertainty and ongoing selling pressure. Recent price action reflects a fragile recovery effort rather than a...
Archive context
Older archive item. Useful for background and entity history, but not a fresh market-moving signal.

Ethereum is attempting to push back above the $2,000 level as the broader crypto market navigates persistent uncertainty and ongoing selling pressure. Recent price action reflects a fragile recovery effort rather than a confirmed trend reversal, with volatility remaining elevated and traders cautious after months of corrective momentum. The $2,000 threshold has become a key psychological and technical battleground, shaping short-term sentiment as investors evaluate liquidity conditions, macro signals, and derivatives positioning.
A recent CryptoQuant analysis offers additional insight into evolving market dynamics, particularly within Ethereum’s derivatives landscape. Data tracking the Estimated Leverage Ratio on Binance shows a clear shift in trader behavior. The indicator recently dropped to around 0.557, marking its lowest reading since last December. This decline follows a period of heightened leverage, when the ratio peaked near 0.675, reflecting a more aggressive risk environment earlier in the cycle.
The reduction in leverage suggests traders are scaling back risk exposure, closing highly leveraged positions, or moving toward more conservative strategies. Such transitions often occur during consolidation phases, when markets attempt to stabilize after volatility spikes.
Declining Leverage Points To Potential Market StabilizationThe analyst further notes that the recent decline in Ethereum’s estimated leverage ratio reflects a broader reduction in speculative risk across the derivatives market. Lower leverage typically indicates that traders are trimming highly leveraged positions or closing them altogether, shifting toward more conservative exposure. Historically, such deleveraging phases have often preceded the formation of new price bases, as market participants prioritize capital preservation over short-term speculative gains.
The drop from roughly 0.675 to around 0.557 is therefore not simply a minor technical fluctuation. Instead, it signals a meaningful shift in market sentiment. Periods characterized by elevated leverage tend to amplify volatility and increase the probability of abrupt liquidations. Conversely, declining leverage generally corresponds with calmer market conditions, where price movements are less driven by forced liquidations and more by underlying demand dynamics.
From a medium-term perspective, this transition may be constructive. Reduced leverage can create a healthier foundation for price discovery, particularly if accompanied by strengthening spot demand. In this context, the combination of lower leverage readings and relatively stable price action suggests the market could be undergoing a consolidation or repositioning phase. Such environments often precede more decisive directional moves once liquidity and sentiment conditions align.
Ethereum Price Remains Under Pressure Below Key AveragesEthereum continues to trade near the $2,000 level after a sharp corrective move that followed its late-2025 highs. The chart shows a clear bearish structure, with price consistently printing lower highs since the October peak while failing to sustain recoveries above key moving averages. Recent attempts to stabilize have produced only shallow rebounds, indicating persistent selling pressure and cautious market positioning.
Notably, ETH remains below its short-, medium-, and long-term moving averages, which are all trending downward. This alignment typically reflects sustained bearish momentum and suggests that rallies may continue to face resistance unless the price can reclaim these levels decisively. The 200-day moving average, currently well above spot price, stands out as a major structural resistance zone.
Volume data also provides context. The most recent sell-off was accompanied by a noticeable spike in trading activity, often associated with liquidation events or accelerated distribution. Since then, volume has moderated, consistent with a consolidation phase rather than an immediate reversal.
From a technical perspective, the $1,900–$2,000 range now acts as a short-term stabilization zone. However, failure to hold this area could expose lower support levels, while a sustained break above nearby resistance would be needed to signal improving momentum.
Featured image from ChatGPT, chart from TradingView.com
Why this matters
Ethereum is showing up inside the Market Structure theme, so this story is worth tracking for follow-through rather than treating it as a one-off headline.
Original source
Read on NewsBTCRelated market context

Massive ETF capital exits threaten Bitcoin’s fragile $86,000 price surge
Bitcoin’s 11.65% weekly rebound now carries evidence of genuine spot and on-chain participation, widening a move that began with h...
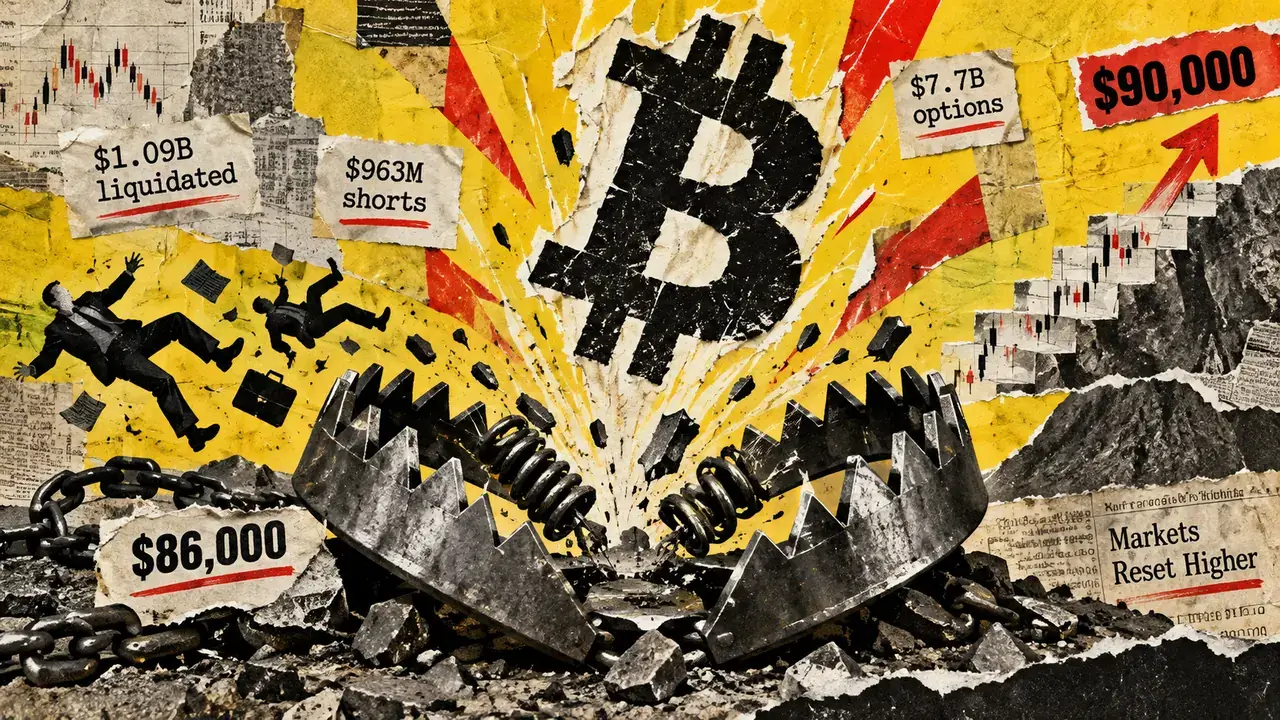
Bitcoin clears $86,000 as $1B in shorts liquidated again – battle now shifts to $90k
Bitcoin’s break above $86,000 has cleared a major pocket of bearish leverage and put $90,000 back in traders’ sights. The largest...

MEXC Expands Opportunity Compass with Stock Trading Handbook to Help Crypto Users Build Investment Knowledge
Mutsamudu, Comoros, September 22, 2026 – MEXC, a pioneer in 0-fee digital asset trading, has expanded its Opportunity Compass educ...

Contrarian Crypto Analyst Who Predicted 2026 Perfectly Calls for Caution and Q4 Crash
Bitcoin pushing back toward $86,000 has many retail traders convinced the bear market is dead and the bulls are back in full contr...
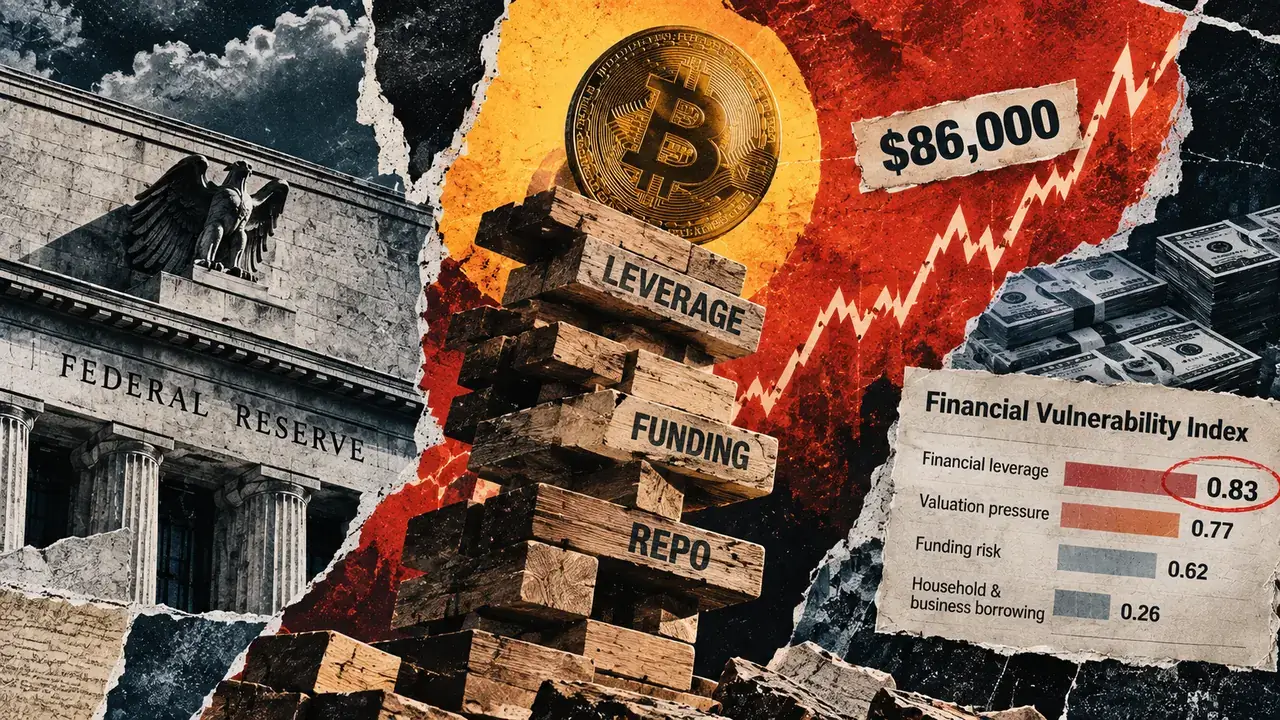
Why Bitcoin’s rally is dangerous according to new Fed data
Bitcoin’s rally and the Federal Reserve’s new financial-risk gauge describe two different time horizons. BTC reflects demand and p...
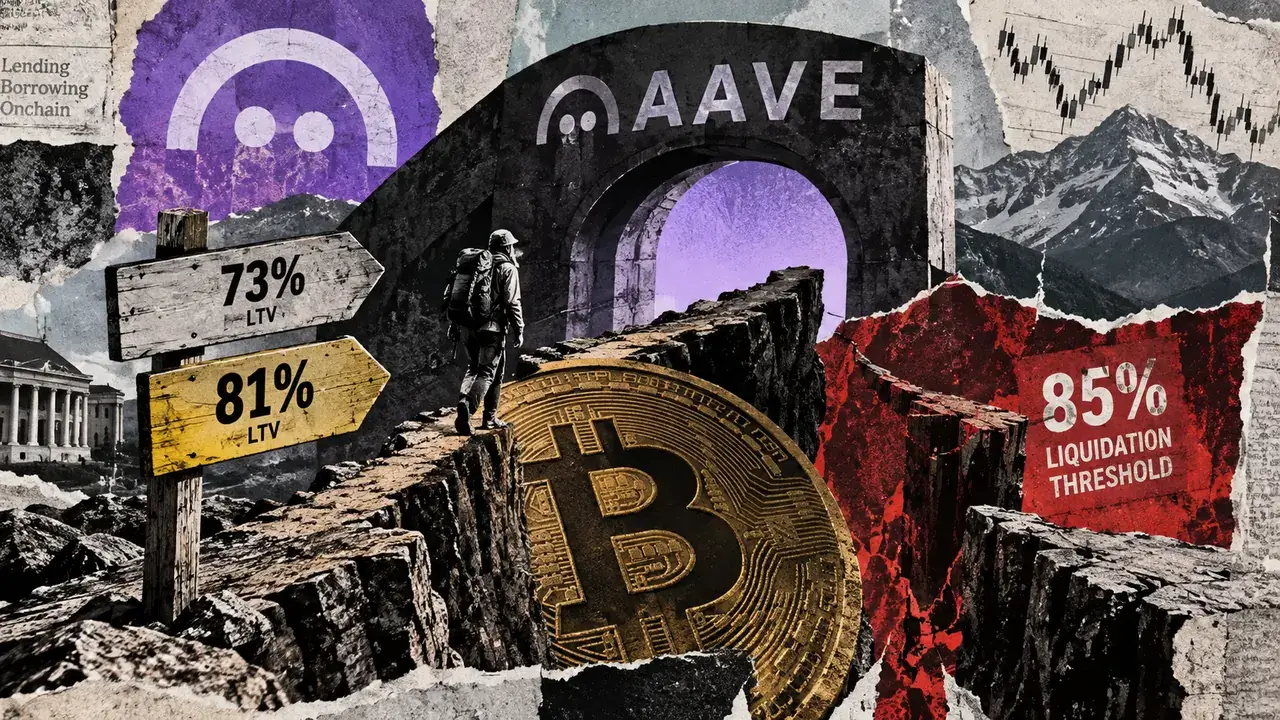
Narrowing price cushions leave Bitcoin loans vulnerable to 4.7% price dips as Aave weighs higher leverage
Aave governance has advanced a proposal that would give Bitcoin-backed borrowers materially more leverage while leaving less room...