TA: Ethereum Avoids a Major Downtrend, Bulls Eye Crucial Breakout
Ethereum started an upside correction above $1,250 against the US Dollar, following XRP rally. ETH could gain bullish momentum if it clears the $1,400 resistance. Ethereum started a recovery wave above the $1,250 and $1,...

Ethereum started an upside correction above $1,250 against the US Dollar, following XRP rally. ETH could gain bullish momentum if it clears the $1,400 resistance.
- Ethereum started a recovery wave above the $1,250 and $1,300 levels.
- The price is now trading above $1,300 and the 100 hourly simple moving average.
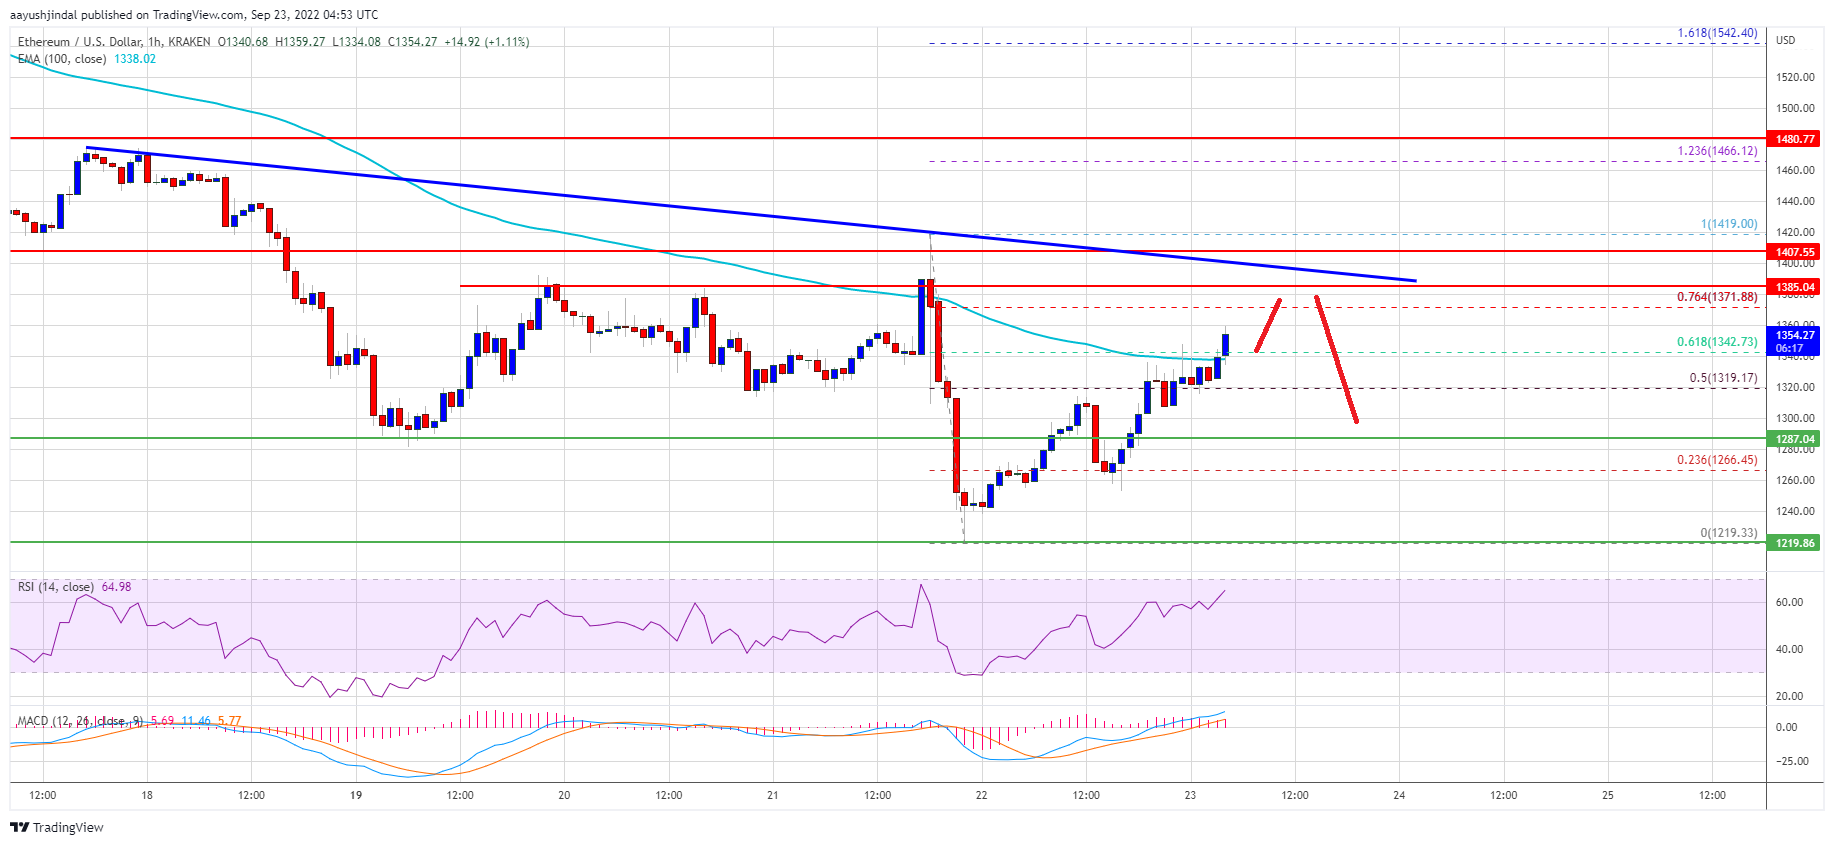
- There is a major bearish trend line forming with resistance near $1,385 on the hourly chart of ETH/USD (data feed via Kraken).
- The pair could recover further it clears the key $1,400 resistance zone.
Ethereum managed to stay above the $1,220 support zone. ETH started an upside correction above the $1,250 level after ripple’s xrp started a strong upward move.
Ether price was able to clear the $1,260 and $1,280 resistance levels. There was a break above the 50% Fib retracement level of the downward move from the $1,420 swing high to $1,220 low. It is now trading above $1,300 and the 100 hourly simple moving average.
It seems like the price is trading in a positive zone above the $1,320 level. On the upside, the price is facing resistance near the $1,380 level.
There is also a major bearish trend line forming with resistance near $1,385 on the hourly chart of ETH/USD. The trend line is near the 76.4% Fib retracement level of the downward move from the $1,420 swing high to $1,220 low.
Source: ETHUSD on TradingView.com
The next major resistance is near $1,400 level. A clear break above $1,400 might start a decent increase towards the $1,450 level. Any more gains may perhaps open the doors for a move towards the $1,500 resistance.
Fresh Decline in ETH?If ethereum fails to recover above the $1,400 resistance, it could start a fresh decline. An initial support on the downside is near the $1,330 zone and the 100 hourly simple moving average.
The next major support is near the $1,288 level. A downside break below the $1,288 support might spark another sharp decline. In the stated case, ether price might drop towards the $1,220 level in the near term. Any more losses could increase selling and the price might drop to $1,150.
Technical Indicators
Hourly MACD – The MACD for ETH/USD is now gaining momentum in the bullish zone.
Hourly RSI – The RSI for ETH/USD is now above the 50 level.
Major Support Level – $1,288
Major Resistance Level – $1,400
Original source
Read on NewsBTCRelated market context

Standard Chartered Says Bitcoin Bottomed Near $59,000 As Crypto Winter Ends
TL;DR Standard Chartered’s Geoffrey Kendrick reportedly says Bitcoin’s $59,000 area marked the cycle bottom. The note cites SpaceX...

Google Gemini AI Predicts Jaw-Dropping XRP Price For Next 90 Days
Google Gemini AI just put XRP back under the spotlight, predicting it is tightly wound for a major breakout toward $1.60 to $1.80...

Bitcoin price challenges $64,000 weekend wall – needing a breakout or risk a deeper correction
Bitcoin reclaimed $64,000 on June 12 and touched an intraday high of $64,301 in the same session that spot ETF flows finally flipp...

Elon Musk SpaceX AI Predicts Incredible Bitcoin Price For Next 30 Days
Here is the thing about capitulation calls. They only sound smart in hindsight. Right now, with Bitcoin price scraping along the l...

Bitcoin rises above $64,000 after Pakistan prime minister says Iran peace deal is near
Bitcoin traded above $64,000 on Saturday, supported by its strongest ETF inflows in a month and growing optimism around geopolitic...

Aave Proposal Moves To Add Circle Wrapped Bitcoin As Collateral
TL;DR Aave Labs has proposed onboarding Circle Wrapped Bitcoin, or cirBTC, to Aave V3 Core and Aave V4 Core on Ethereum. The propo...