TA: Ethereum Just Reversed and $1,700 Seems Imminent, Here’s Why
Ethereum started a major recovery wave from $1,500 against the US Dollar. ETH rallied nearly 10% and might aim a move towards the $1,700 resistance. Ethereum started a major increase after the bulls appeared near the $1,...

Ethereum started a major recovery wave from $1,500 against the US Dollar. ETH rallied nearly 10% and might aim a move towards the $1,700 resistance.
- Ethereum started a major increase after the bulls appeared near the $1,500 zone.
- The price is now trading above $1,600 and the 100 hourly simple moving average.
- There is a key bearish trend line forming with resistance near $1,650 on the hourly chart of ETH/USD (data feed via Kraken).
- The pair must clear $1,650 to continue higher towards $1,700 in the near term.
Ethereum saw a major decline below the $1,600 support similar to bitcoin. ETH even dived below $1,550 before the bulls took a stand.
It seems like the bulls defended the $1,500 support. A low was formed near $1,490 and the price started a major increase. There was a clear move above the $1,550 and $1,580 resistance levels. Ether even cleared the 50% Fib retracement level of the key drop from the $1,685 swing high to $1,490 low.
It is now trading above $1,600 and the 100 hourly simple moving average. The price even spiked above the $1,650 level. It is also consolidating near the 76.4% Fib retracement level of the key drop from the $1,685 swing high to $1,490 low.
An immediate resistance on the upside is near the $1,650 level. Besides, there is a key bearish trend line forming with resistance near $1,650 on the hourly chart of ETH/USD.
Source: ETHUSD on TradingView.com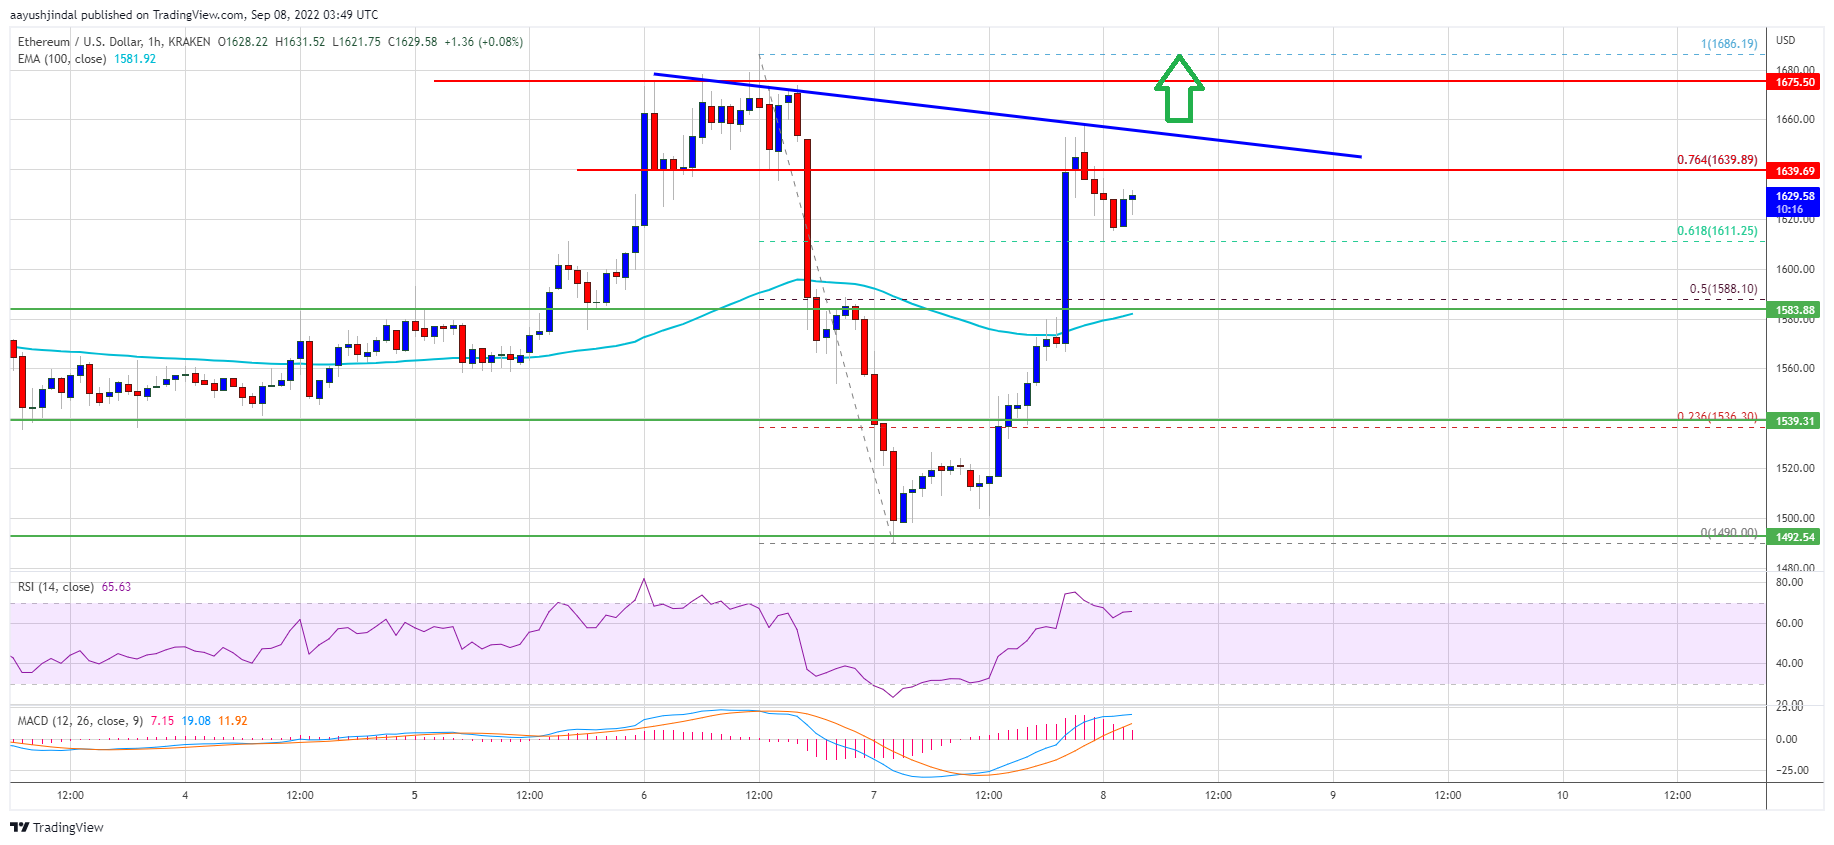
The next major resistance is now forming near the $1,675 level. Any more gains may perhaps open the doors for a move towards the $1,700 resistance in the near term. A clear move above the $1,700 resistance could pump the price towards the $1,800 level.
Fresh Decline in ETH?If ethereum fails to rise above the $1,650 resistance, it could start a fresh downside correction. An initial support on the downside is near the $1,610 zone.
The next major support is near $1,585 and the 100 hourly simple moving average. A downside break below the $1,585 support might start a sharp decline. In the stated case, ether price might decline towards the $1,540 level.
Technical Indicators
Hourly MACD – The MACD for ETH/USD is now losing momentum in the bullish zone.
Hourly RSI – The RSI for ETH/USD is now above the 50 level.
Major Support Level – $1,585
Major Resistance Level – $1,650
Original source
Read on NewsBTCRelated market context

Uranium Holds Above $85 as Mining ETF Rebounds From June Sell-Off
The latest charts display that the market is divided into stable physical prices and uranium shares trying to regain momentum afte...

Standard Chartered Says Bitcoin Bottomed Near $59,000 As Crypto Winter Ends
TL;DR Standard Chartered’s Geoffrey Kendrick reportedly says Bitcoin’s $59,000 area marked the cycle bottom. The note cites SpaceX...

Bitcoin rises above $64,000 after Pakistan prime minister says Iran peace deal is near
Bitcoin traded above $64,000 on Saturday, supported by its strongest ETF inflows in a month and growing optimism around geopolitic...

Elon Musk’s trillionaire status puts his net worth above crypto’s entire market cap outside Bitcoin
Elon Musk has become the first person in modern history to amass a personal net worth exceeding $1 trillion, crossing the historic...

Tether USDT Briefly Overtakes Ethereum in Market Cap: A $187B Wake-Up Call
For a few hours, earlier this week, Tether USDT stablecoin held a higher market cap than Ethereum, the first time that has happene...

Google Gemini AI Predicts Jaw-Dropping XRP Price For Next 90 Days
Google Gemini AI just put XRP back under the spotlight, predicting it is tightly wound for a major breakout toward $1.60 to $1.80...