TA: Ethereum Key Indicators Suggest A Strengthening Case For More Losses
Ethereum declined sharply from the $1,655 resistance zone against the US Dollar. ETH is struggling and remains at a risk of more losses below the $1,450 level. Ethereum started a fresh decline after it failed to clear th...

Ethereum declined sharply from the $1,655 resistance zone against the US Dollar. ETH is struggling and remains at a risk of more losses below the $1,450 level.
- Ethereum started a fresh decline after it failed to clear the $1,650 resistance zone.
- The price is now trading below $1,550 and the 100 hourly simple moving average.
- There is a major bearish trend line forming with resistance near $1,610 on the hourly chart of ETH/USD (data feed via Kraken).
- The pair could accelerate further lower below the $1,450 support zone in the near term.
Ethereum failed to gain strength for a move above the $1,650 and $1,660 resistance levels. ETH formed a top near the $1,653 level and started a fresh decline.
There was a steady decline below the $1,600 level and the 100 hourly simple moving average. The price even traded below the $1,550 and $1,520 support levels. There was a drop over around 10% and the price traded as low as $1,453.
Ether price is now consolidating losses above the $1,450 level and below the 100 hourly simple moving average. On the upside, the price is facing resistance near the $1,500 level. It is near the 23.6% Fib retracement level of the recent decline from the $1,653 swing high to $1,453 low.
The next major resistance is near the $1,550 and $1,560 levels. It is near the 50% Fib retracement level of the recent decline from the $1,653 swing high to $1,453 low.
Source: ETHUSD on TradingView.com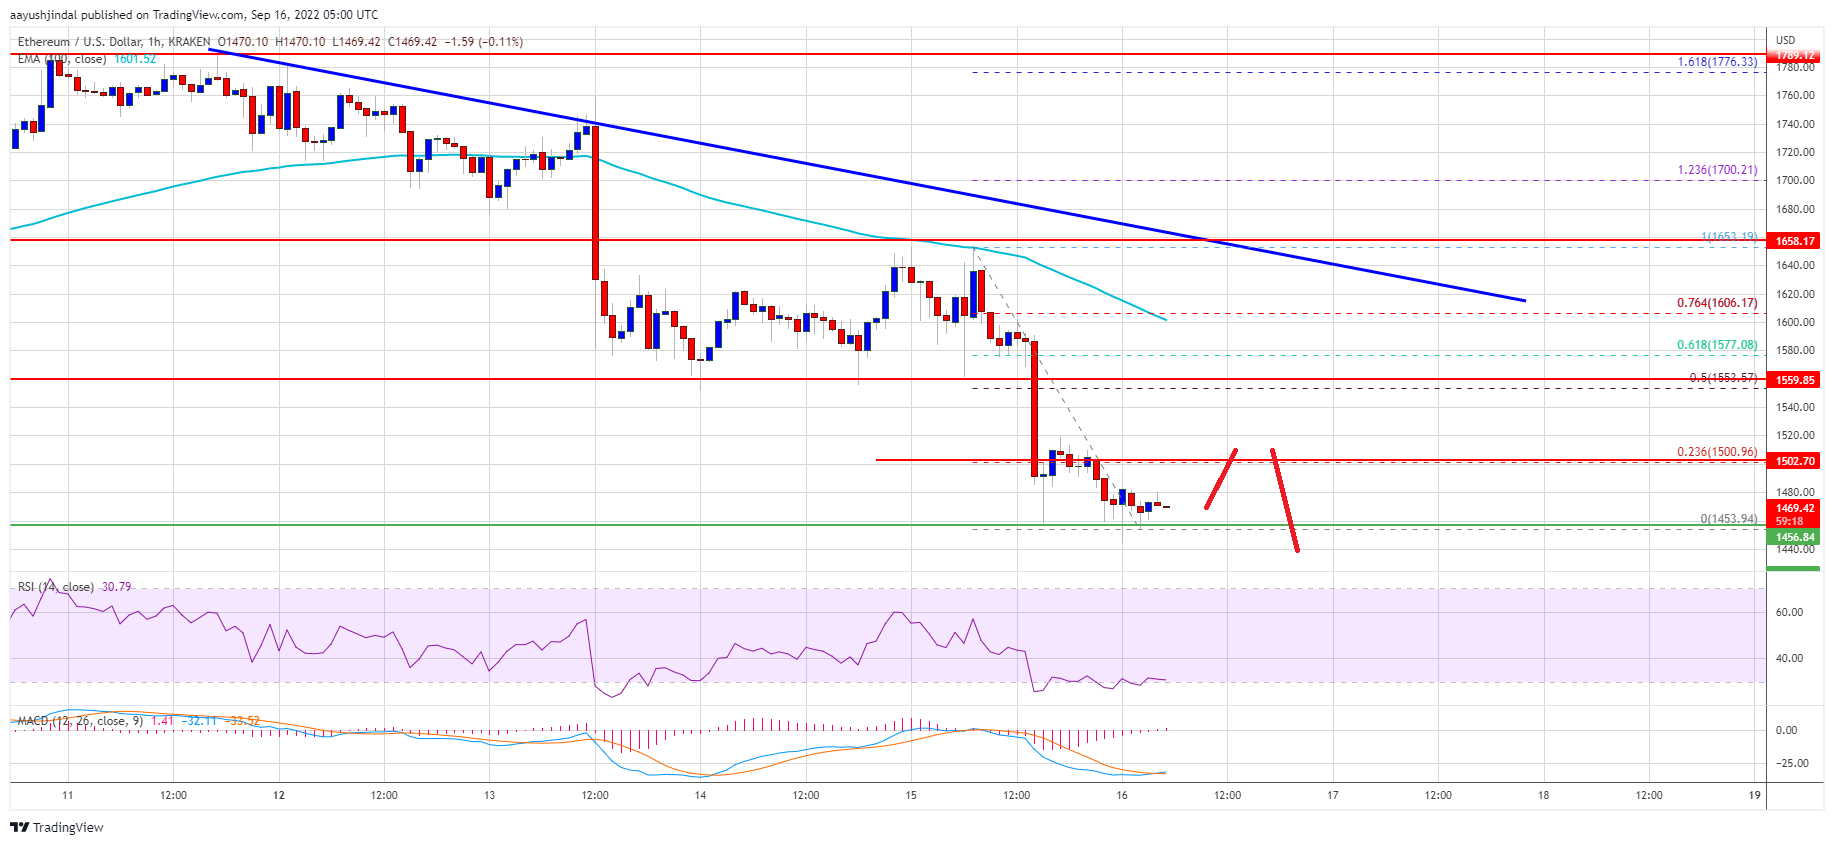
A clear break above $1,560 might send the price towards the $1,600 level. There is also a major bearish trend line forming with resistance near $1,610 on the hourly chart of ETH/USD. Any more gains may perhaps open the doors for a move towards the $1,650 resistance in the near term.
More Losses in ETH?If ethereum fails to rise above the $1,500 resistance, it could continue to move down. An initial support on the downside is near the $1,450 zone.
The next major support is near $1,420. A downside break below the $1,420 support might another sharp decline. In the stated case, ether price might decline towards the $1,350 level.
Technical Indicators
Hourly MACD – The MACD for ETH/USD is now gaining momentum in the bearish zone.
Hourly RSI – The RSI for ETH/USD is now below the 50 level.
Major Support Level – $1,450
Major Resistance Level – $1,550
Original source
Read on NewsBTCRelated market context

Standard Chartered Says Bitcoin Bottomed Near $59,000 As Crypto Winter Ends
TL;DR Standard Chartered’s Geoffrey Kendrick reportedly says Bitcoin’s $59,000 area marked the cycle bottom. The note cites SpaceX...

Michael Saylor says investor confidence in Ethereum has collapsed
Ethereum's declining investor confidence signals a shift towards Bitcoin dominance, emphasizing real-world utility over speculativ...

Blackrock’s IBIT Leads $86 Million Bitcoin ETF Inflow as Ethereum Funds Extend Outflow Streak
Spot bitcoin exchange-traded funds (ETFs) drew $85.85 million in net inflows on Friday, with every one of the 12 tracked funds avo...

Ethereum Foundation’s Kohaku proposes post-quantum account protection for $0.07
Kohaku's opt-in quantum protection could accelerate Ethereum's security evolution, influencing investor confidence and market dyna...

Wall Street is moving past crypto pilots and deeper into Ethereum, says Etherealize founder
In an interview with CoinDesk, Etherealize cofounder Vivek Raman said Ethereum is currently in a transitional phase where the infr...

US forces shoot down Iranian attack drones near Strait of Hormuz, Bitcoin drops below $73K
Geopolitical tensions near vital oil routes can destabilize financial markets, highlighting the interconnectedness of global secur...