TA: Ethereum Price Could Rally If It Closes Above This Key Level
Ethereum is showing positive signs above the $1,300 level against the US Dollar. ETH could rally if it clears the $1,330 and $1,350 resistance levels. Ethereum is slowly moving higher and trading above the $1,300 level....
Archive context
Older archive item. Useful for background and entity history, but not a fresh market-moving signal.

Ethereum is showing positive signs above the $1,300 level against the US Dollar. ETH could rally if it clears the $1,330 and $1,350 resistance levels.
- Ethereum is slowly moving higher and trading above the $1,300 level.
- The price is now trading above $1,310 and the 100 hourly simple moving average.
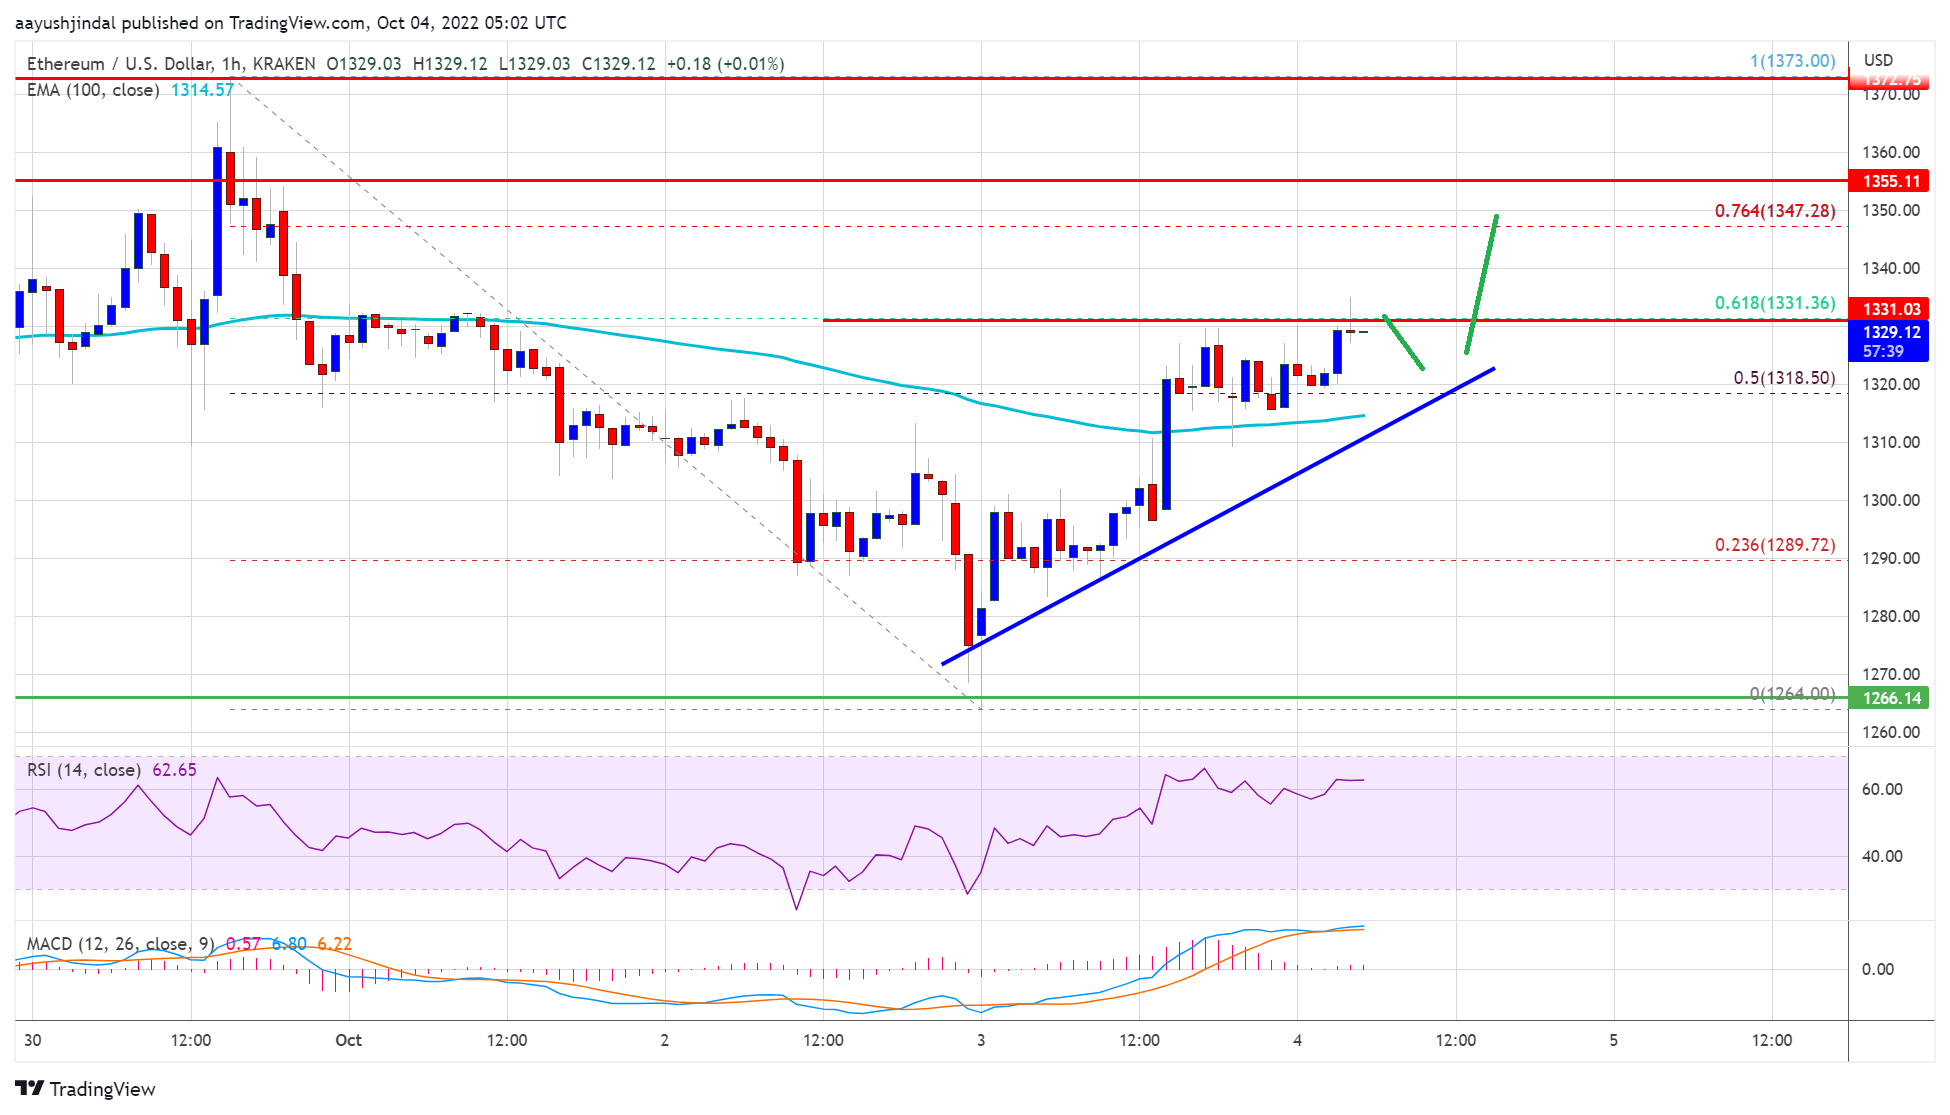
- There is a key bullish trend line forming with support near $1,320 on the hourly chart of ETH/USD (data feed via Kraken).
- The pair could gain bullish momentum if there is a clear move above the $1,350 resistance.
Ethereum remained well bid above the $1,250 level. There was a minor increase above the $1,280 and $1,288 levels. ETH is showing positive signs above the $1,300 level and the 100 hourly simple moving average.
The price climbed above the 50% Fib retracement level of the downward move from the $1,372 swing high to $1,265 swing low. The price even settled above the $1,310 level and the 100 hourly simple moving average.
There is also a key bullish trend line forming with support near $1,320 on the hourly chart of ETH/USD. On the upside, the price is facing resistance near the $1,330 zone. It is near the 61.8% Fib retracement level of the downward move from the $1,372 swing high to $1,265 swing low.
Source: ETHUSD on TradingView.com
A clear break above $1,330 might start a decent increase towards the $1,355 level. If the bulls remain in action, the price could rise towards the $1,375 level. Any more gains may perhaps open the doors for a move towards the $1,400 resistance zone. The next major resistance sits near the $1,450 level.
Fresh Decline in ETH?If ethereum fails to climb above the $1,355 resistance, it could start a fresh decline. An initial support on the downside is near the $1,320 level and the trend line.
The next major support is near the $1,290 level. A downside break below the $1,290 level might send the price towards the $1,255 support. Any more losses could increase selling and the price might drop to $1,220 or even towards $1,200 in the coming sessions.
Technical Indicators
Hourly MACD – The MACD for ETH/USD is now gaining momentum in the bullish zone.
Hourly RSI – The RSI for ETH/USD is now just above the 50 level.
Major Support Level – $1,320
Major Resistance Level – $1,375
Why this matters
This ethereum story adds another data point to the current market tape and is useful when read alongside nearby source coverage.
Original source
Read on NewsBTCRelated market context

Ethereum Price Prediction: ETH is Evolving Beyond A Blockchain
Ethereum is trading near $2,650, down 2.3% over 24 hours, but the real story isn’t in the candles or its price prediction. Vitalik...

Claude AI Predicts XRP Could Hit $10 in 2026: How Does it Get There
In ideal bull-market conditions, Anthropic’s Claude AI predicts Ripple (XRP) could hit $10, assuming sustained liquidity, expandin...

Ethereum moves closer to faster finality with decoupled consensus protocol
Ethereum's faster finality could enhance its competitiveness in high-value transactions and cross-chain bridging, reducing delays...

Ethereum is not instant, but collateral could make it feel that way
When a payment app tells you a transfer is complete, you start making decisions. You hand over whatever you've sold, spend the mon...

Ethereum’s next scaling leap may come from making everyone stop doing the same work
Ethereum co-founder Vitalik Buterin says advances in cryptography could turn decentralization from a performance cost into a scali...

Ethereum’s 2030 Shift: Vitalik Maps a Cryptographic World Computer Beyond Blockchain
Key Takeaways: According to Vitalik Buterin, Ethereum is going further than simply being a blockchain to “cryptographic world comp...