The Last Time Ethereum Did This Against Bitcoin, It Exploded Above $4,000
Ethereum is back at a point on its Bitcoin pair where the price action has always started to ask a dangerous question: is ETH still weak, or is it being priced for another rotation? A new ETH/BTC chart shared by crypto a...
Archive context
Older archive item. Useful for background and entity history, but not a fresh market-moving signal.

Ethereum is back at a point on its Bitcoin pair where the price action has always started to ask a dangerous question: is ETH still weak, or is it being priced for another rotation?
A new ETH/BTC chart shared by crypto analyst BLADE shows Ethereum falling through 14 straight lower closes against Bitcoin, taking the pair below the same relative strength zone during its February low. The setup matters because the last visit to that area came at a moment of heavy pessimism around Ethereum. A few weeks later, ETH began to outperform Bitcoin, and the move eventually carried Ethereum above $2,450.
Ethereum Returns To The Same ETH/BTC Buy ZoneBLADE’s analysis focuses on the Ethereum/Bitcoin pair, where ETH has moved into a clear short-term breakdown against BTC after weeks of steady underperformance. The pair was trading above 0.0313 in April, but that level gave way as sellers continued to pressure Ethereum relative to Bitcoin.
By May, ETH/BTC had fallen below 0.027 after recording 14 consecutive lower closes, dragging it to its lowest level since July 2025. That decline means that the Ethereum price has not only been falling in dollar terms or struggling with the broader crypto market but has also been losing ground directly against Bitcoin.
However, the most recent red candle on the ETH/BTC pair turned out to be a doji candlestick, which is the ultimate candlestick of indecision. The current candlestick is still green, and the Ethereum price is now in a position of outperforming the Bitcoin price.
Interestingly, the deeper point in BLADE’s analysis is where the decline has brought the pair. The ETH/BTC RSI has returned to the same support zone that appeared around the February low, near the lower 30s on the indicator. That zone is highlighted on the chart below as the area where momentum became stretched enough in February for Ethereum to begin recovering against Bitcoin.
What’s Next For Ethereum?At the time of writing, the ETH/BTC pair is trading at 0.02835, which is about 35% below its August 2025 high of 0.0434. This was the last time the Ethereum price was in a period of peak outperformance against Bitcoin, and it led to a breakout above $4,000 and its current all-time high of $4,946.
Ethereum’s current setup is not identical to August 2025, but the rhythm is similar enough. The pair has returned to the same momentum support area, and the lower-close sequence has become stretched. The pair now needs to stop printing lower closes and reclaim the breakdown zone, and Ethereum starts seeing more inflows compared to Bitcoin, especially as BTC has now broken below $70,000 in the past 24 hours.
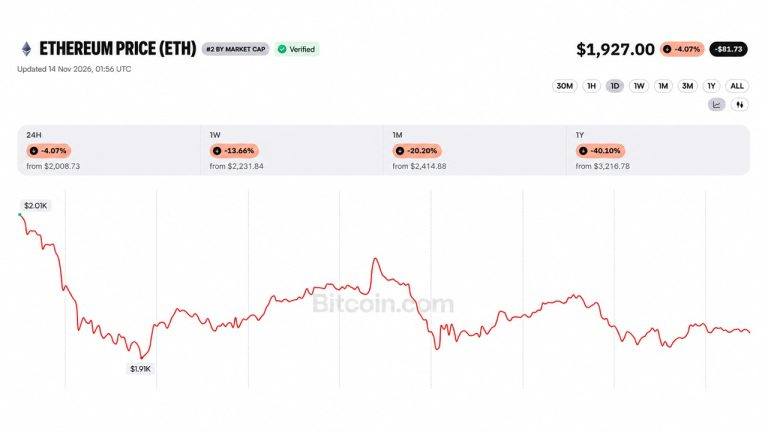
However, Ethereum has not been immune to the broader market weakness either, with ETH also falling below $2,000 in the past 24 hours.
Why this matters
Bitcoin is a tracked market entity in the DigitalMoneyBox archive, making this useful context for readers monitoring repeated mentions and follow-up coverage.
Original source
Read on NewsBTCRelated market context

U.S. Targets $1.2 Billion From Binance Hack—Where Is the Rest?
The Binance hack recovery has reached a significant milestone: U.S. authorities say more than $1.2 billion in stolen cryptocurrenc...
Ether Price Dips Below $2K as Ethereum Foundation Dumps 5000 ETH in 5 Day
A wallet linked to the Ethereum Foundation sold another 1,000 ETH on Saturday, taking its five-day total to 5,000 ETH, or about $9...

Ethereum Dancing on Two Fronts as Quantum Upgrade Advances and Treasury Leverage Bites
Ethereum developers want to upgrade the network to be quantum-ready by 2027, potentially accelerating one of its biggest security...

Bitcoin Breaks Below $70,000 as Liquidations Sweep Through Leveraged Longs
Bitcoin (BTC) fell below $70,000 late Thursday in the U.S. and kept sliding past midnight, touching $67,555 on Coinbase as forced...

LIVE – Why Is Crypto Down? $14.2B Stablecoin Drain Turns a Bad Morning Into a Market-Wide Rout
Why is crypto down? Bitcoin crashed below $69,000 just now, dragging the crypto markets into another brutal selloff. Ethereum slip...

Lithium Market Outlook as $90,650 Spot Meets a Heavy ETF Resistance Wall in Q4
The Global X Lithium and Battery Tech ETF, on the other hand, dropped 2.64% to $59.46. This divergence indicates that there is not...