Binance Price Prediction Eyes 78% Rally as $723 Resistance Breaks
Binance Coin (BNB) has pushed past a multi-year resistance at $723, signaling the beginning of a new upward trajectory. At the time of writing, BNB is stabilizing above key levels while short-term and daily indicators sh...
Archive context
Older archive item. Useful for background and entity history, but not a fresh market-moving signal.

Binance Coin (BNB) has pushed past a multi-year resistance at $723, signaling the beginning of a new upward trajectory.
At the time of writing, BNB is stabilizing above key levels while short-term and daily indicators show continued strength. This momentum could drive prices toward the $1,200 to $2,600 range in the medium term.
Multi-Year Chart Structures Signal Strong Macro BreakoutA detailed monthly chart from analyst @borsaray highlights a breakout attempt for BNB/USDT as price approaches the top of a consolidation range held since 2021. The current level of around $704.94 has breached the lower end of a historical resistance band between $680 and $790.
This area has had capped price movement for three years. The ongoing candle for July 2025 is showing strong upward momentum, bolstered by increasing volume, an early indicator of institutional buying pressure.
Source: X
The analyst emphasizes a potential continuation pattern forming as a bullish rectangle. A successful monthly close above $790 would confirm a structural breakout, potentially initiating a multi-phase rally.
Using Fibonacci analysis and historical rally data, projected medium-term targets range between $1,200 and $2,600. The presence of a dashed trendline extending toward $4,000 suggests further upside potential if momentum continues. @borsaray’s caption, describing BNB as the “king of the square,” implies that Binance Coin could outperform other altcoins during the next growth phase.
Source: X
In a separate analysis, @signalunited presented a long-forming cup-and-handle pattern on the multi-year timeframe. The neckline, located near the $723 resistance, has now been breached. This formation, spanning from 2021 to 2025, typically leads to significant upside when completed. The first bullish target of $1,200 corresponds to the 0.786 Fibonacci extension, while the second, at $2,600, aligns with the 1.382 level.
With the handle portion forming over the past two years, the breakout candle now reflects a high-conviction move backed by strong structure and volume. Fibonacci support zones at $117, $67, and $33 remain relevant in the event of a broader market pullback.
24-Hour Chart Shows Short-Term Resistance TestIn the latest 24-hour session, BNB reached an intraday high near $755 before facing resistance, with price retreating to $732.52 by the end of the day, down 0.60%. The pullback occurred on low volume, which often signals a lack of conviction from buyers following a sudden spike.
Candle patterns reflect short-term indecision, with buyers attempting to defend support around $725 to $730. This suggests the market is currently pausing following an initial breakout push.
Source: BraveNewCoin
Despite short-term rejection, BNB maintains a strong overall market position. With a trading volume of $2.85 billion and a market cap of $106.83 billion, the token holds the fifth rank globally. The circulating supply stands at 145.88 million BNB.
If price reclaims $740 with increased buying volume, it may retest $755. A breakdown below $728 could lead to short-term corrections toward $715–$720. However, the broader trend remains bullish due to confirmed higher timeframe breakouts and pattern completion.
TradingView Bollinger Bands Confirm Strength at the Time of WritingThe daily chart on TradingView shows BNB trading at $733.70, up 0.52%, after breaking above the upper Bollinger Band level at $731.93. This breakout followed days of consolidation around the Bollinger Band of $680.77.
The BBPower reading at 60.57 confirms strong buying momentum as the price moves away from the mean. The structure of the current rally includes full-bodied bullish candles and minimal retracement, signaling strong market participation.
Source: TradingView
Resistance now stands at $765.56, while support has shifted to the $720–$730 region. The expanding Bollinger Band width suggests rising volatility, favoring buyers. The ongoing rally remains technically sound as long as the price stays above the midline of $680.77.
With strong BBPower, expanding bands, and a bullish structure intact, Binance Coin may be preparing for the next upward leg as macro patterns align with short-term strength.
Why this matters
This research story adds another data point to the current market tape and is useful when read alongside nearby source coverage.
Original source
Read on Brave New CoinRelated market context

XRP Price Prediction: Chart Mirroring 2016, Targeting $23
XRP trades at around the $1.50 price level, slightly down, but a long-range chart comparison points to a $23 prediction. The resem...

Microsoft Copilot AI Predicts Chainlink (LINK) Could Hit $100 in 2026
Microsoft Copilot AI predicts that in a world where Chainlink becomes the backbone of a major global settlement system, such as SW...

Mark Zuckerberg Meta AI Predicts Double-Digit XRP Price by 2026
Currently priced at approximately $1.50, Mark Zuckerberg’s Meta AI predicts that XRP could surge above $10 this year, a gain of ar...

Bitcoin Price Stays Out of the Red as This Bear Market Breaks a Historic Pattern
Bitcoin price drawdown never produced a daily close below realized price this cycle, while aggregate NUPL remained positive throug...
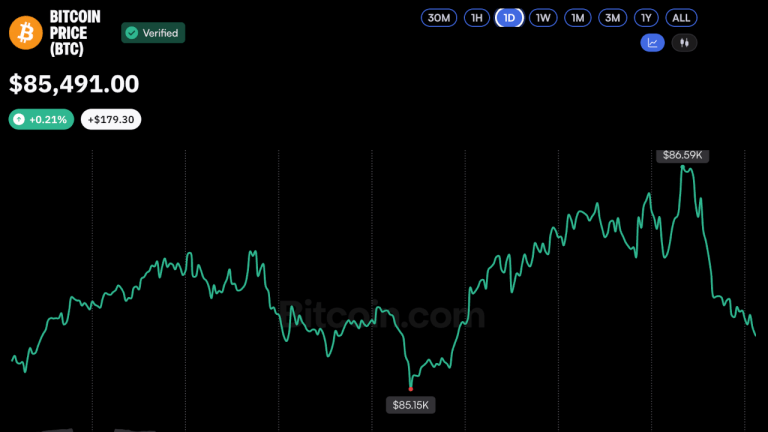
Bitcoin Price Holds October Gains After Two Surges Above $86K
Bitcoin twice rose above $86,000 on Tuesday, supported by momentum from the CFTC’s proposed cryptocurrency regulations and a recen...

Ethereum Price Prediction: Last-Minute Glamsterdam Fix Sets Stage for 200M Gas Jump
Ethereum trades at just under $2,700 as validators prepare for Glamsterdam’s Sepolia activation, which could lift its price predic...