Dogwifhat Price Prediction: Bullish Outlook Builds Above 0.14300 Support Level
Daily trading volume climbed to approximately USDT 234.16 million, while the market capitalization now stands at over USDT 814.83 million. With a circulating supply nearing 999 million WIF, current market dynamics sugges...
Archive context
Older archive item. Useful for background and entity history, but not a fresh market-moving signal.

Daily trading volume climbed to approximately USDT 234.16 million, while the market capitalization now stands at over USDT 814.83 million. With a circulating supply nearing 999 million WIF, current market dynamics suggest that the token may be attempting to establish a new base of support.
Short-Term Structure Reinforced by Volume and Pattern RecognitionOver the past 24 hours, WIF has maintained a steady climb within its intraday structure, forming higher lows and preserving upward momentum. This price behavior is supported by stable trading volumes, which do not show abnormal spikes that often accompany speculative activity.
Source: Brave New Coin
Instead, the volume pattern appears consistent, suggesting organic participation from buyers rather than rapid inflows from short-term speculation. The hourly chart shows that WIF has managed to hold above key short-term moving averages, reflecting a relatively stable market posture.
An analyst, Crypto Joereal, on social media recently identified a Double Bottom pattern on the 30-minute chart for WIF/USDT. The pattern, typically interpreted as a potential reversal signal, points to a short-term bullish setup. If the neckline resistance is broken with sufficient volume, a projected target of USDT 0.902 could be realized.
Source: X
This technical insight complements the broader data showing stable liquidity and market cap growth. However, the area around USDT 0.90 also presents a possible resistance level where traders may take profits, emphasizing the need to monitor volume behavior as the price approaches that zone.
Dogwifhat Price Prediction: Potential Recovery Zone Identified Between 0.674 and 0.621A separate technical review according to Finora AI on the daily timeframe has identified a key support region for WIF price between USDT 0.674 and 0.621. The price is currently trending just above this zone after retracing from a local high near USDT 1.35 recorded in early June.
According to this outlook, a dip into this zone followed by a reversal could signal a recovery toward USDT 0.939, with additional resistance levels marked at USDT 1.064 and 1.169. This scenario would depend on confirmation signals such as a bullish candlestick formation or a liquidity sweep within the highlighted zone.
Source: X
The analysis further notes that a daily close below USDT 0.621 would nullify the bullish outlook and open the possibility of a deeper correction. In that case, key downside levels to observe would be USDT 0.452 and 0.304.
These areas have previously acted as accumulation zones during earlier market cycles. The analyst recommends waiting for a reversal confirmation before initiating long positions, focusing on candle structures and breakouts on lower time frames. This approach emphasizes structured entry conditions while minimizing exposure to false signals.
The broader market context shows a prolonged downtrend followed by a partial recovery, and now a period of consolidation. The region between USDT 0.75 and 1.00 continues to act as a significant pivot, where price frequently reacts.
Reclaiming and holding above USDT 0.939 could trigger a move toward the higher resistance range. However, traders are also watching for reversal patterns in this area, as liquidity accumulation may lead to rejection setups, reinforcing the importance of confirmation in upcoming sessions.
Technical Indicators Show Early Signs of Momentum ShiftThe WIF/USDT daily chart reflects a broad consolidation phase following a sharp move earlier this year. Currently trading around USDT 0.818, the price has recently pulled back after failing to maintain levels above USDT 0.85. Nonetheless, the formation of higher lows in the past two weeks suggests that the token is attempting to stabilize. The relatively small range of recent candles implies a reduction in market volatility, often a precursor to directional expansion.
Source: TradingView
The Bollinger Band Power (BBPower) indicator registers a value of 0.035, indicating mild bullish strength. This transition from negative to positive territory is viewed as a subtle signal of increasing buyer interest. However, momentum has yet to accelerate significantly, and sustained green readings will be necessary for a stronger directional move. Currently, the market remains in a neutral to slightly positive zone, awaiting further confirmation from price action.
In addition, the Relative Strength Index (RSI) currently reads 48.68, positioned above its moving average of 43.66. This crossover may indicate growing bullish momentum, but with the RSI still below the neutral 50 level, a confirmed trend reversal is not yet established. A decisive move above 50 would support the bullish thesis and may coincide with price attempts to retest upper resistance levels. For now, both BBPower and RSI provide early indicators of shifting sentiment, which will require follow-through in the coming sessions to validate a sustained upward move.
Why this matters
This research story adds another data point to the current market tape and is useful when read alongside nearby source coverage.
Original source
Read on Brave New CoinRelated market context

XRP Price Prediction: Chart Mirroring 2016, Targeting $23
XRP trades at around the $1.50 price level, slightly down, but a long-range chart comparison points to a $23 prediction. The resem...

Mark Zuckerberg Meta AI Predicts Double-Digit XRP Price by 2026
Currently priced at approximately $1.50, Mark Zuckerberg’s Meta AI predicts that XRP could surge above $10 this year, a gain of ar...

Google Gemini AI Predicts Chainlink (LINK) to Hit $300 by 2027
Google Gemini AI predicts that, assuming a full-blown crypto bull market returns and is turbocharged by a landmark catalyst, LINK...

Microsoft Copilot AI Predicts Chainlink (LINK) Could Hit $100 in 2026
Microsoft Copilot AI predicts that in a world where Chainlink becomes the backbone of a major global settlement system, such as SW...
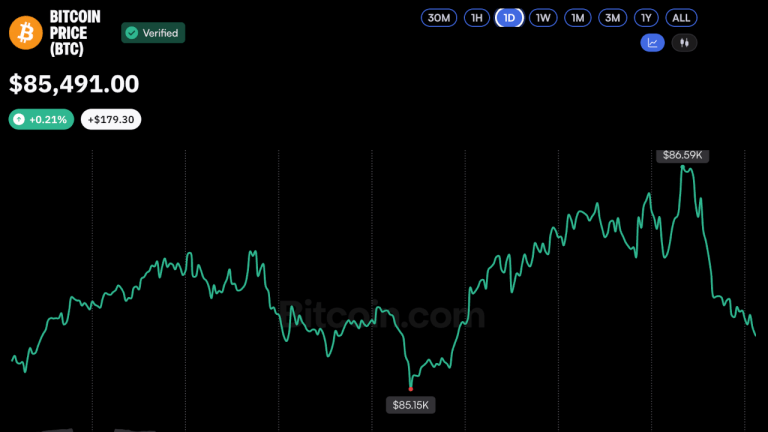
Bitcoin Price Holds October Gains After Two Surges Above $86K
Bitcoin twice rose above $86,000 on Tuesday, supported by momentum from the CFTC’s proposed cryptocurrency regulations and a recen...

Ethereum bears keep selling but ETH price stays near $2,700 as US spot ETFs record $206M in outflows
Ethereum’s institutional demand is weakening around the same time derivatives positioning shows traders are selling aggressively w...