Floki Price Prediction: Technical Indicators Show Signs of Momentum Reversal
While short-term charts point to a pullback, derivative market metrics and weekly indicators suggest rising interest and potential strength ahead. With volatility increasing and trading activity intensifying, market part...
Archive context
Older archive item. Useful for background and entity history, but not a fresh market-moving signal.

While short-term charts point to a pullback, derivative market metrics and weekly indicators suggest rising interest and potential strength ahead.
With volatility increasing and trading activity intensifying, market participants are watching closely to assess whether FLOKI could be on the verge of a more pronounced move.
FLOKI/USD Chart Analysis: Rising Open Interest Signals Strong Market EngagementThe 1-hour chart of FLOKI/USD from Coinalyze illustrates a sharp uptrend that developed on May 21, followed by a gradual correction. The price reached a high near $0.0001200 before retreating to around $0.0001016, where it is currently stabilizing.
Despite the price softening, the broader structure still reflects a series of higher lows and higher highs, pointing to a constructive setup. This short-term consolidation appears to be the result of profit-taking after a swift rally, with the price remaining above a key psychological threshold at $0.0001000.
Source:Coinalyze OpenInterest
Additionally, aggregated open interest (OI) has demonstrated a strong rise during the recent move. Derived from FLOKI/USD, FLOKI/USDT, and FLOKI/BUSD contracts, the total OI spiked from below $4 million to nearly $6 million, before consolidating at $4.87 million. This increase signals growing participation in derivative markets.
The rise in OI alongside price appreciation typically indicates that traders are opening new positions in anticipation of further price movement. The absence of a sharp decline in OI during the current consolidation phase suggests confidence remains intact, with traders likely awaiting a potential breakout.
Source:X
More so supporting this technical view, a recent post by (@ConsoleFuture) noted a 0.01% funding rate, which reflects balanced sentiment between long and short positions. FLOKI’s circulating supply of 9.6 trillion tokens and a market cap of $1 billion provide depth but also contribute to its sensitivity to speculative activity. Future price action may depend on volume confirmation and macro or ecosystem-driven developments.
FLOKI 24-Hour Chart Analysis: Price Slips 10% Amid Strong VolumeOn the other hand, the latest 24-hour trading session saw FLOKI fall by 10.22%, with the token closing at $0.0001019 after opening near $0.0001115. This sharp intraday drop occurred mainly during the early hours of the session and showed minimal recovery afterward.
Brief attempts to reclaim lost ground were quickly rejected, leading to a lower daily close near session lows. The chart indicates sellers maintained control, pushing the price down in a steady pattern throughout the day.
Source:BraveNewCoin
Nevertheless, the trading volume remained elevated, reaching $219.45 million, suggesting that liquidity and market interest in FLOKI remain strong. The consistent volume throughout the day, even during price declines, indicates that many participants were actively exiting or repositioning their trades.
This may suggest widespread profit-taking following the recent rally or a shift in sentiment ahead of key resistance tests. With over 9.66 trillion tokens in circulation, FLOKI’s price is more susceptible to volatility, especially during sentiment-driven movements.
FLOKI’s ecosystem includes several functional platforms such as Valhalla (NFT Metaverse Game), Floki University, DeFi solutions, and the FlokiPlaces NFT Marketplace. These components offer potential value anchors, which may support price resilience over time.
However, the current price correction highlights the need for caution, especially if volume begins to wane without corresponding upward momentum. A return to bullish sentiment may require renewed buying pressure or positive developments within the project’s ecosystem.
Weekly Technical Indicators Show Signs of Momentum ReversalAdditionally, the weekly chart of FLOKI/USDT from TradingView reveals a steady shift in price direction, following a prolonged multi-month downtrend. The token reached a low around $0.00004545 before beginning a slow but consistent recovery. Currently priced at $0.00010198, FLOKI has posted its fifth consecutive green weekly candle, reflecting a 1.78% increase.
The recent candles show smaller bodies and wicks, suggesting consolidation and potential accumulation by market participants.
Source:TradingView
Momentum indicators are beginning to align with this shift. The MACD is close to a bullish crossover, with the MACD line at -0.00001642 and the signal line at -0.00002197. The histogram has turned positive at 0.00000556, which typically signals a reduction in bearish pressure.
Should the MACD complete its crossover, this could confirm the start of a longer-term trend reversal. Such a signal, particularly on a weekly timeframe, may support medium-term bullish forecasts.
Additionally, the RSI has climbed to 49.12, moving gradually toward the key 50 mark. While not yet in bullish territory, this increase reflects growing interest from buyers. A sustained break above 50 would reinforce the notion that market sentiment is recovering.
The chart structure, combined with the improving indicators, suggests that FLOKI is entering a phase of consolidation with a cautiously optimistic outlook. However, confirmation through continued price strength and increasing volume will be key to validating any parabolic projection.
Why this matters
This research story adds another data point to the current market tape and is useful when read alongside nearby source coverage.
Original source
Read on Brave New CoinRelated market context

BlackRock ETF clients buy $22.38 million worth of Bitcoin
BlackRock's ETF inflows highlight growing institutional interest in Bitcoin, potentially stabilizing its market and influencing br...

Ledger hack scare nears $90 million as Tether moves to freeze stolen USDT
Suspected Ledger wallet thefts are approaching $90 million as Tether freezes USDT stablecoin linked to the incident, according to...

Ethereum open interest rose 2.3% in ETH on Binance as its dollar value fell 6.6%
Ethereum open interest in Binance’s ETHUSDT futures contract was 2.27% higher in ETH on Thursday, Oct. 8, over the last 48 hours,...
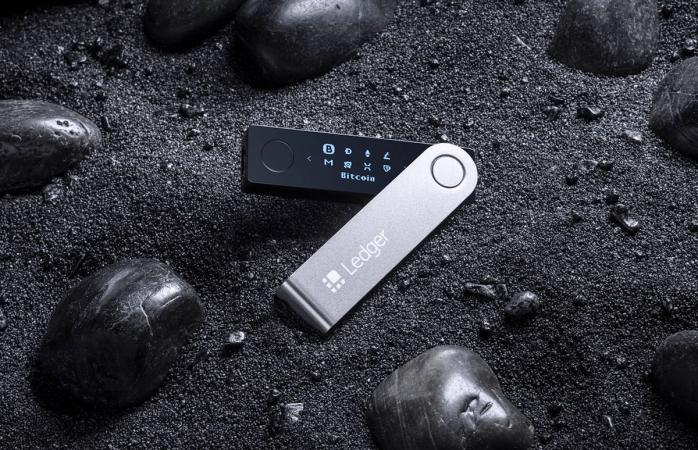
Ledger investigates potential wallet tampering after reports of $86 million in crypto stolen
The hardware wallet maker said it is investigating devices sold by a Southeast Asian reseller as social posts swirl about crypto a...

What Is Crypto Spot Trading?
For example, a token can be up 70% and still be a terrible trade if you have no idea when to take profits. Likewise, a 30% dip can...

Ledger Probes Potential Theft of $87M in User Funds Tied to Crypto Wallet Reseller
Ledger asked reseller CryptoBilis to pause sales and urged recent buyers not to set up their devices, as an onchain investigator t...