Gold Price Analysis: Bearish Structure Holds as Traders Eye Key Zones
XAUUSD broke down on the charts, but sellers still had the edge in the longer term following a clear breakdown in market structure. But the near term wasn’t as clear-cut. A 1-hour pattern showed a potential retracement a...
Archive context
Older archive item. Useful for background and entity history, but not a fresh market-moving signal.

XAUUSD broke down on the charts, but sellers still had the edge in the longer term following a clear breakdown in market structure.
But the near term wasn’t as clear-cut. A 1-hour pattern showed a potential retracement after buying liquidity was absorbed near the lows, with traders divided over whether the longer-term move will continue lower or whether there will be a short-term recovery towards the intraday highs.
Downsiders Still in Overall AscendancyValeriya Breakout said XAUUSD remains bearish, noting price provided a CHoCH to the downside and is still below a significant level. On her 4-hour chart, gold broke down from underneath a noted structure zone between $4,580-$4,590, with the price currently close to $4,572 and expected to move lower after a pullback into the noted supply zone.
Additionally, the X chart shows the market is already out of its former bullish run. Price took its liquidity, structure turned over, and now the price is below the prior support zone. While the market remains below that mitigation zone, the default bias is to the downside on that setup.
Daily Structure Points LowerThe daily chart from SIRRILLAH had the same bias but with a bigger target. The post featured bearish continuation from about 4,650 down to 4,000 on a stepped structure, which gave repeated lower highs after the steep reversal from the March-April highs.
Notably, the daily X chart view highlighted a red band of supply in the upper $4,900-$5,000 zone, and gold trading significantly lower in the $4,550-$4,600 zone. It then projected a decline towards $4,100-$4,000. Interestingly, this view places the recent weakness in the context of a trend continuation, rather than a temporary correction.
Short-Term Rebound Remains PossibleOn one hand, analyst Dayyib Sanka wrote on the tactical 1-hour chart. The post said that traders should focus on yesterday’s high, noting a short-term sweep below support on the chart, followed by a rebound from the current region to the next daily objective line at over $4,700.
On the other hand, this does not mean that the X chart’s long-term bearish outlook is invalid. But it suggests that gold might first rebound after taking intraday liquidity around the $4,552-$4,560 area. It also showed a fair value gap around $4,660, which might serve as an intermediate support zone (if buyers can push the price from its latest low).
Overall, the three charts display a still-bearish market on the longer time frames, while allowing for an intraday bounce before the next major move kicks in. In the meantime, the crucial battleground lies between $4,580 and $4,650 on the upside and around the latest low of around $4,550.
Why this matters
This maps to the Market Structure hub, so it can help confirm whether that theme is gaining breadth across the crypto news cycle.
Original source
Read on Brave New CoinRelated market context
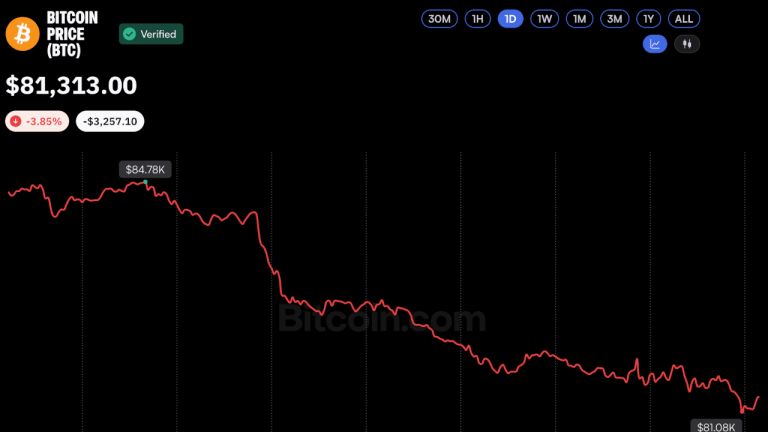
Bitcoin Price Plunges Below $81K Despite $1 Billion in ETF Inflows
Bitcoin dropped below $82,000 to an intraday low of $80,836 during a late Wednesday sell-off, capping a nearly 4% daily loss and h...

Bloomberg’s Mike McGlone: AI Risk Could Force Bitcoin Drawdown to $10,000
▶Bitcoin Magazine Bloomberg’s Mike McGlone: AI Risk Could Force Bitcoin Drawdown to $10,000 Mike McGlone was one of the few Wall S...

Ethereum Glamsterdam Upgrade Delayed Over Smart Contract Security Risks
Ethereum developers have postponed the Glamsterdam upgrade on the Hoodi testnet after researchers identified potential security ri...

Mark Zuckerberg Meta AI Predicts an Insane Run for BTC in Q4
Something potentially seismic could be approaching for Bitcoin by January 1, 2027. Mark Zuckerberg’s Meta AI predicts that if a fu...

Bitcoin Faces $85,000–$87,500 Supply Test After $80,000 Rebound
TL;DR: Glassnode’s October 21 report identifies an overhead Bitcoin supply zone around $85,000–$87,500 after bids returned near $8...

Bitcoin Slides Below $82,000 as Treasury Yields Break Below 5% and EU Debt Fears Grip Markets
Bitcoin fell to $81,500, down 3.3%, as the 10-year Treasury yield dipped below 5% and French-German bond spreads hit a 15-year hig...