Hedera Price Maintains 0.24 Support While Setting Up for a Strong Upswing
The earlier cycle saw HBAR surge from under $0.01 to over $0.50 after months of accumulation. Today, the token is consolidating between $0.03 and $0.10, which Steph says could precede another multi-month bull run. Curren...
Archive context
Older archive item. Useful for background and entity history, but not a fresh market-moving signal.

The earlier cycle saw HBAR surge from under $0.01 to over $0.50 after months of accumulation. Today, the token is consolidating between $0.03 and $0.10, which Steph says could precede another multi-month bull run.
Currently, HBAR trades at $0.24 with a market capitalization of $10.22 billion and a daily volume of $170.1 million, according to CryptoPulse. Analysts note key levels at $0.24 support and $0.244 resistance, eyeing a dip near $0.223 before a rebound toward $0.28–$0.30.
Historical Pattern Suggests a New Expansion PhaseAnalyst STEPH compares Hedera’s current chart structure with its breakout cycle from 2020 to 2021. During that earlier period, the altcoin traded below $0.01 before surging above $0.50 after an extended base-building phase. The rally produced multiple new highs until a broad crypto market correction in 2022 ended the upward move.
HBARUSDT Chart | Source:x
The 2024–2025 setup shows similar characteristics. The asset has remained in a range between $0.03 and $0.10 for several months, creating a foundation that resembles the earlier accumulation phase. According to the analyst, repeating this structure may prepare it for another strong upward phase if overall market conditions and adoption remain favorable.
Current Trading Range and Technical StructureMarket data shows Hedera trading near $0.24, with a 0.38% gain over the last 24 hours. The 24-hour chart records price movements between $0.239 and $0.244, reflecting moderate intraday volatility. Trading volume stands at $170.1 million, and the network maintains a market capitalization of $10.22 billion with a circulating supply of about 42.39 billion, keeping it among the top 25 digital assets.
HBAR 24-Hr Chart | Source: BraveNewCoin
The intraday pattern included an early push toward $0.244, a pullback to $0.241, and a subsequent midday recovery before closing near the current level. This movement indicates that sellers were active near the $0.244 resistance point, containing upward momentum. Despite this resistance, steady market participation supports a stable short-term outlook.
Analysts Track Support Levels and Accumulation ZonesResearch from CryptoPulse shows that the asset has averaged around $0.23 in trading volume since its September pivot. With broader market activity cooling as October approaches, the analyst warns of a possible brief dip below this average. On the two-hour chart, the token maintains a higher-low structure with price action near $0.243, while key support holds close to $0.22.
HBAR USDT Chart | Source:x
CryptoPulse indicates that a pullback toward or slightly under $0.23 may offer a favorable area for accumulation. Their chart projects a potential near-term move toward $0.223, followed by a rebound capable of retesting the $0.28–$0.30 range. Such a move could create opportunities for buyers seeking strategic entries if the expected short-term dip occurs.
Key Price Levels for the Next Market MoveFrom a technical view, $0.24 acts as immediate support, and $0.244 remains the critical resistance level. A strong break above $0.244 may attract additional buying interest and open the way to higher short-term targets. Conversely, sustained trading below $0.24 would indicate weakening momentum and the possibility of deeper pullbacks.
With trading volume stable and market participants closely watching these boundaries, analysts consider the upcoming sessions important for determining its next trend. Maintaining the current higher-low structure and defending the $0.22 support could provide the platform needed for the next upswing, aligning with the historical pattern observed in earlier Hedera cycles.
Why this matters
This research story adds another data point to the current market tape and is useful when read alongside nearby source coverage.
Original source
Read on Brave New CoinRelated market context

Ethereum (ETH) Price Prediction: Whale Rotates $155M Into ETH as Longs Surge Near $2,500
Ethereum is trying to stabilize after another volatile stretch, with price returning toward the mid-$2,400 region while several po...
CoinShares BTF Liquidation Sets Cash Payout And Earlier Options Expiry
TL;DR: CoinShares’ Bitcoin and Ether ETF has reached cash settlement. An OCC notice confirms the payout and brings later-dated BTF...
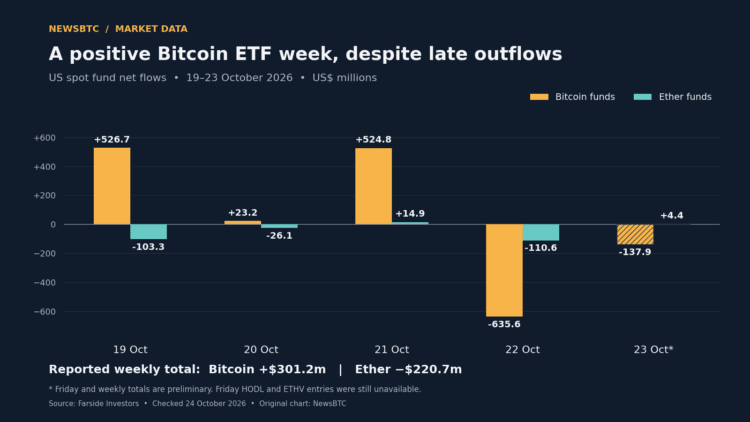
Bitcoin ETF Week Stays Positive After Nearly $774 Million In Late Outflows
TL;DR: Farside’s preliminary figures show US Bitcoin funds retaining a $301.2 million weekly inflow despite two days of withdrawal...

Kalshi and Polymarket hit record $2.7 billion in weekly crypto volume
The surge in crypto prediction market volume highlights a shift towards short-term speculative trading, impacting traditional trad...
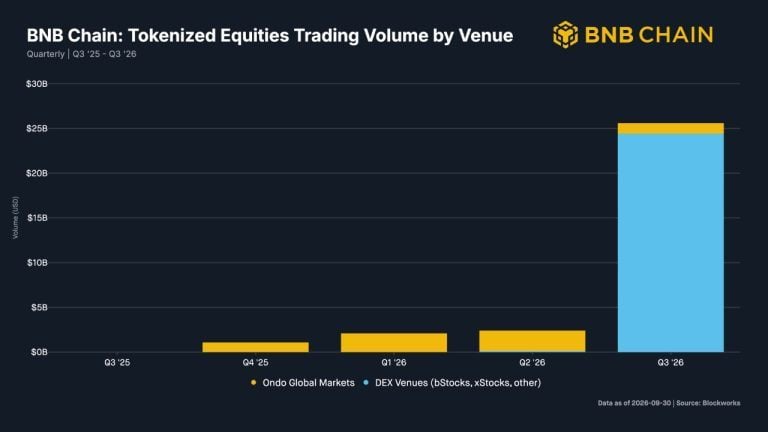
BNB Chain Tops Solana, Robinhood as Equity Volume Jumps 11x to $25.6B
BNB Chain emerged as the leading blockchain for tokenized equities in the third quarter, with trading volume surging to about $25....
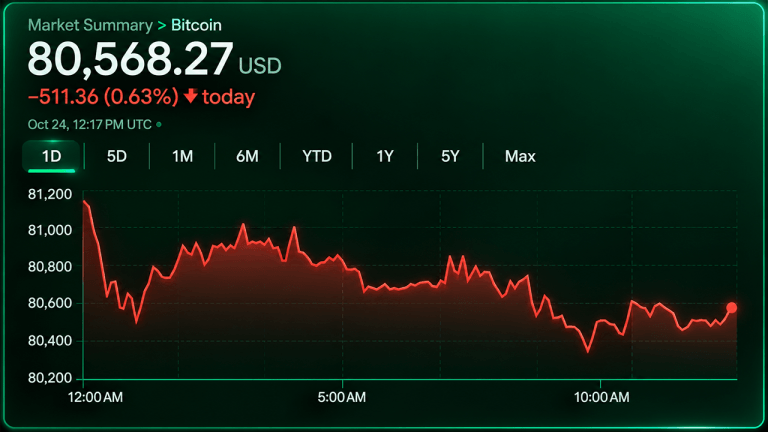
Bitcoin Price Faces $78K Threat as Sellers Hammer Key Support
Bitcoin’s price traded near $80,500 Saturday morning, Oct. 24, with sellers controlling the shorter time frames despite longer-ter...