Hedera Price Prediction: HBAR Holds $0.14 Support as Market Cap Hits $6.1B
Hedera Hashgraph (HBAR) price prediction is clinging to the $0.14 support level after failing to break through a critical resistance zone near $0.15. Market participants are closely monitoring whether HBAR will continue...
Archive context
Older archive item. Useful for background and entity history, but not a fresh market-moving signal.

Hedera Hashgraph (HBAR) price prediction is clinging to the $0.14 support level after failing to break through a critical resistance zone near $0.15. Market participants are closely monitoring whether HBAR will continue within its downtrend or build momentum for a reversal. Despite recent declines, short-term chart formations suggest a potential shift in sentiment. However, a decisive move is needed before a clear trend direction emerges.
Descending Channel Signals Continued Pressure Below $0.15The 4-hour chart recently shared by @AltwolfCrypto highlights a descending channel that has guided HBAR’s movement since early May.
The 50 EMA has reinforced this downtrend, acting as dynamic resistance during every attempted recovery. Each rejection around the $0.15 mark has aligned with the channel’s upper boundary, making it a pivotal level for traders watching for either continuation or reversal.
Source: X
HBAR’s price prediction, most recent rejection near $0.15, suggests the pattern remains intact, with a projected path pointing toward the $0.125 region, where prior support has historically attracted buying interest. The channel is well respected, and unless the price closes convincingly above both the 50 EMA and descending resistance, the bias remains tilted to the downside.
AltWolf’s analysis emphasizes how tightly the asset is being compressed within this bearish structure, creating pressure that could soon result in a breakout or deeper correction.
Market Data Reflects Cautious Sentiment Despite Strong FundamentalsAdditionally, HBAR is currently trading at $0.14, down 4.45% over the past 24 hours, according to Brave New Coin. The asset maintains a solid market position, ranking #29 globally with a market capitalization of over $6.1 billion.
The circulating supply stands at approximately 42.37 billion tokens, and 24-hour trading volume is near $139.6 million, indicating steady market engagement. These figures underline the coin’s continued liquidity and presence despite prevailing bearish pressure.
Source: Brave New Coin
Recent chart data from Brave New Coin covering July 1–2 shows HBAR consolidating near $0.14 following a rejection at $0.15. This zone appears to be acting as interim support, though momentum remains weak.
The downward slope of recent candles and subdued volume highlight a cautious market, possibly waiting for a breakout signal. Traders are focusing on this region for directional clues, especially as the broader crypto market displays signs of mixed sentiment.
Short-Term Patterns Offer Reversal Hopes as Buyers Monitor Key LevelsIn a separate update, @CryptoJoeReal pointed to a bullish pennant forming on the 1-hour timeframe. This short-term structure follows a strong upward movement and features converging trendlines, suggesting price compression.
Source: X
If HBAR breaks out above the pennant’s resistance, the projected price target stands at $0.1837. While this view contrasts with the dominant downtrend on higher timeframes, it offers an intraday scenario that could spark renewed interest if confirmed by volume.
The daily technical chart from TradingView places HBAR at $0.1448, showing minimal daily gains of 0.06%—a small uptick following continued consolidation. The Balance of Power (BoP) indicator remains negative at -0.00855, reflecting seller strength.
Source: TradingView
Meanwhile, the Relative Strength Index (RSI) has recently crossed above its moving average, now sitting at 41.31. Although still below the neutral zone, this shift may suggest early signs of buying interest. For HBAR to break free from its range, a decisive move above $0.16 with strong volume is required. Until then, the coin remains bound within technical levels that have yet to confirm a clear breakout or breakdown.
Why this matters
This research story adds another data point to the current market tape and is useful when read alongside nearby source coverage.
Original source
Read on Brave New CoinRelated market context
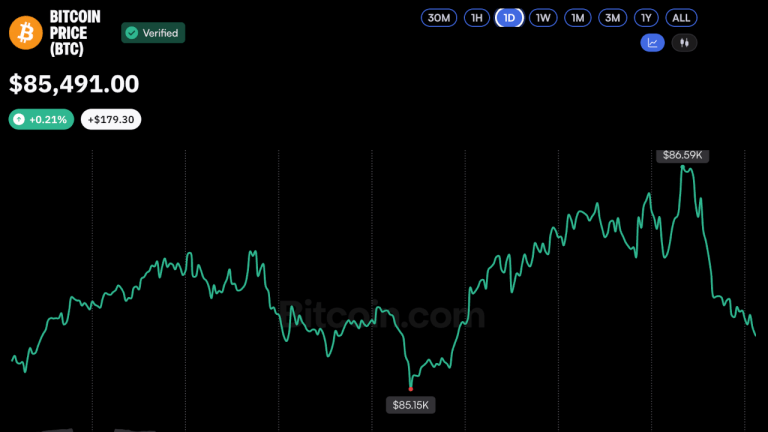
Bitcoin Price Holds October Gains After Two Surges Above $86K
Bitcoin twice rose above $86,000 on Tuesday, supported by momentum from the CFTC’s proposed cryptocurrency regulations and a recen...
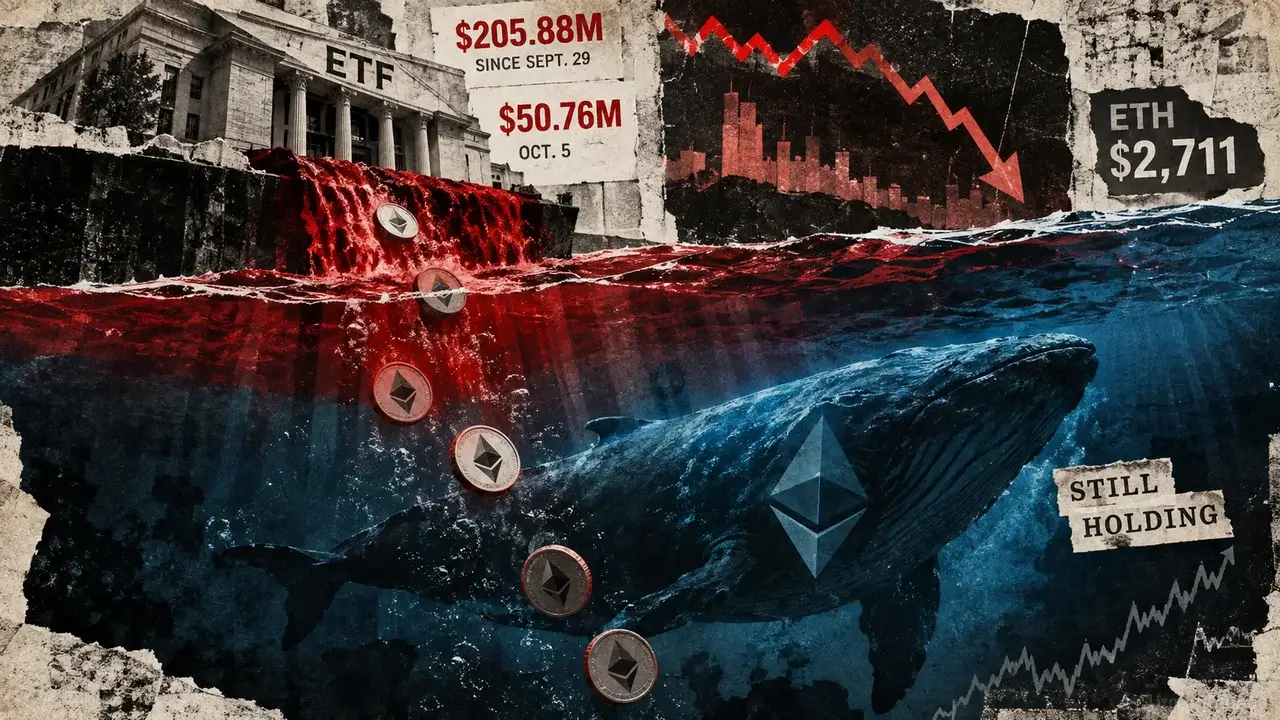
Ethereum bears keep selling but ETH price stays near $2,700 as US spot ETFs record $206M in outflows
Ethereum’s institutional demand is weakening around the same time derivatives positioning shows traders are selling aggressively w...
Bitcoin falls nearly $2,000 in 20 minutes as $400 million in longs get liquidated
The rapid liquidation highlights the volatility and risks of leveraged trading, potentially deterring cautious investors and impac...

Coinbase launches live crypto price prediction markets
Coinbase's new prediction markets could increase user engagement but may also lead to heightened risk-taking and regulatory scruti...

First National Bank opens Bitcoin trading to nearly 9 million clients
FNB's move into crypto trading could accelerate mainstream adoption in South Africa, influencing both banking practices and regula...

Zcash and Monero lead gains as Bitcoin remains flat
The rise of privacy coins like Zcash and Monero highlights growing investor interest in decentralized finance, despite regulatory...