"Jackson Holed", But the Crack in the Back of the Nasdaq 100 Index's Rally is still a Concern.
In my Substack Blog post published a week ago, last Wednesday, I stated that there were several technical factors, as the title suggested, that there was potential “Early Signs of a Crack in the Back of the Nasdaq 100 In...
Archive context
Older archive item. Useful for background and entity history, but not a fresh market-moving signal.
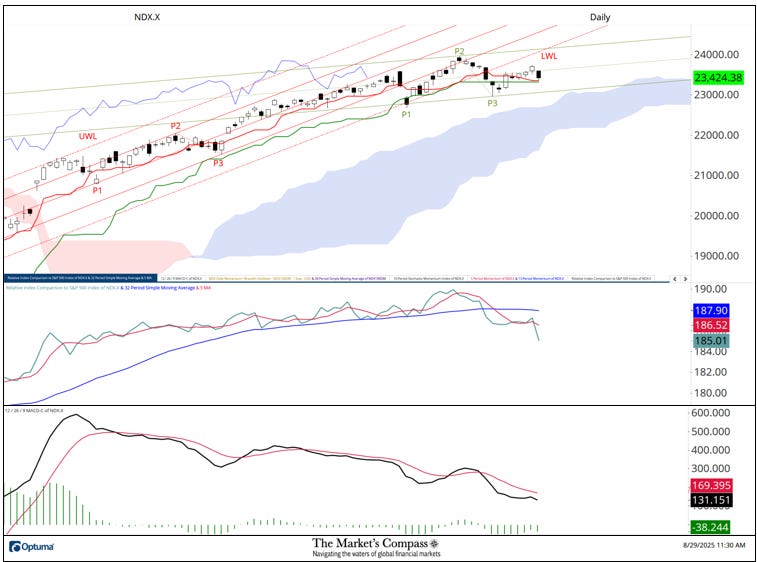
In my Substack Blog post published a week ago, last Wednesday, I stated that there were several technical factors, as the title suggested, that there was potential “Early Signs of a Crack in the Back of the Nasdaq 100 Index’s Rally”. My only concern at that time was that I was sticking my neck out with that warning, considering that over the remainer of the week there was a few potential news events that could invoke volatility in the rates market that would likely overflow into the equity markets. That proved to be a reasonable concern, and my technical thesis was promptly “Jackson Holed” last Friday and investors were caught “wrong sided” and equities, including the NDX Index rallied sharply. In doing so it retook the ground back above the broken Kijun Plot (green line) There was a measure follow through over the rest of the week until today. That five-day rally from a week ago last Wednesday’s low could not even begin to challenge the Lower Warning Line (red dashed line) of the longer-term Standard Pitchfork (red P1 through P3).
I drew a shorter-term Schiff Pitchfork (green P1 though P3) after last Friday’s rally that encompasses what I think is a distributive top. Note the continued Relative underperformance vs. the SPX in the lower panel. Below that, MACD only briefly stabilized but has turned lower again (note histogram in green) and remains below its signal line. I now mark first support at the Lower Parallel of the new Schiff Pitchfork and second remains at Cloud Support. Note that the Cloud is no longer mirroring the vector of the longer-term Standard Pitchfork. My technical thesis of that we are witnessing a distributive top will be negated with a rally that is able retake the ground above the Lower Parallel (red LWL) and the August 13th price pivot at green P2
Chart is courtesy of Optuma
The Market's Compass Technical View is a reader-supported publication. To receive new posts and support my work, consider becoming a free or paid subscriber.
Why this matters
This research story adds another data point to the current market tape and is useful when read alongside nearby source coverage.
Original source
Read on The Market's CompassRelated market context
Bitcoin could put the average ETF buyer back in losses this week
Bitcoin registered an intraday low of $82,775.94 on Sept. 29 before rebounding above $83,000, close to a price that could change t...

Ethereum (ETH) Price Prediction: Coinbase Buying Picks Up as ETH Eyes a $2,720 Breakout
Ethereum price is consolidating near $2,680 as buyers attempt to maintain the recovery and push through the next resistance zone....

Stretched Profits and Cooling Demand Put Bitcoin Rally on Pause — For Now: Report
Bitcoin Magazine Stretched Profits and Cooling Demand Put Bitcoin Rally on Pause — For Now: Report Bitcoin’s recent run may be slo...

Altcoins Gain Momentum Amid $2.77B Bitcoin ETF Inflows as BTC Rebounds From $82.5K
At the same time, the Bitcoin price is attempting to stabilize after falling toward the $82,500 area, while market data shows trad...

Ethereum Gets Another Privacy Boost as Aztec Brings Back zk.money
Aztec Labs relaunched its self-custodial zk.money wallet on Aztec Network, letting users make private stablecoin payments using re...

Strategy Buys 1,665 More Bitcoin And Spends $152M Buying Back STRC
TL;DR Strategy bought 1,665 BTC for approximately $142.7 million between September 21 and September 27. The company now holds 847,...