SEI Price Prediction: Macro Breakout Fuels 400% Target Toward $1.57
Backed by a sharp reversal from critical support zones, analysts from X, including Solberg Invest and @KriptoEditoru, are aligning their outlook toward higher targets, with the primary resistance breakout paving a path t...
Archive context
Older archive item. Useful for background and entity history, but not a fresh market-moving signal.

Backed by a sharp reversal from critical support zones, analysts from X, including Solberg Invest and @KriptoEditoru, are aligning their outlook toward higher targets, with the primary resistance breakout paving a path toward $1.57.
Macro-Chart Signals Trend Reversal as Analysts Confirm Accumulation PhaseThe weekly SEI/USDT macro-chart shared by Solberg Invest shows a successful breakout above a descending trendline that capped price growth for over a year. This move confirms structural reversal as the token rallies from the $0.12–$0.22 accumulation zone, now acting as strong support.
Source: X
The chart also reflects Solberg’s price trajectory, forecasting a multi-leg climb toward $0.70, $1.00, and a key target at $1.57. The price is currently up over 150% from the entry level suggested by the analyst, supported by increasing trading volumes and the formation of higher lows. His prediction is backed by a typical trend reversal structure, seen in previous crypto cycles.
Source: X
@KriptoEditoru adds context from a shorter time frame, emphasizing the $0.40 resistance level as the most significant price ceiling in the near term. This level overlaps with historical resistance zones from early 2024. Failure to clear this range could cause a retracement to lower support zones, while a break above $0.40 is expected to open a path toward $0.629 and beyond.
Analyst also highlighted the weekly breakout earlier this week, stating that SEI had exited its downtrend and could now enter “trend continuation territory,” with momentum aligning closely with Q3 altcoin rotation trends.
SEI Price Prediction: 24-Hour Data Shows Weakened Momentum Near ResistanceAccording to BraveNewCoin’s latest 24-hour data, SEI has pulled back 4.74%, currently hovering around the $0.35 zone. Volume over the same period stood at USDT 322 million, a moderate decline compared to the surge recorded during the recent breakout.
This suggests a temporary pause in buying momentum as the token approaches critical resistance at $0.38–$0.40.
Source: BraveNewCoin
The price has struggled to maintain higher highs after reaching $0.3903 earlier in the day. Relative volatility has also compressed, indicating hesitation among short-term buyers. Market sentiment remains cautiously bullish, but the lack of strong continuation confirms the need for additional consolidation before the next breakout attempt.
Despite the short-term pullback, the broader market structure remains intact. Analysts caution that holding above $0.3030 will be essential in preserving the current uptrend pattern.
At the Time of Writing, Bollinger Bands Indicate a Pullback Is HealthyAt the time of writing, SEI is trading near $0.3544 after testing intraday highs of $0.3903. The daily TradingView chart shows SEI pulling back below the upper Bollinger Band, signaling a temporary cooling of momentum. The price remains above the midline Bollinger Band at $0.3033, which now acts as dynamic support.
Source: TradingView
The Bollinger Band Power (BBPower) indicator has started to decline, signaling reduced volatility from its recent highs in early July. However, the fact that SEI is holding above the mid-band suggests bullish structure is still valid. If the token successfully retests the $0.38–$0.40 zone, renewed momentum could initiate the next leg toward $0.629 and eventually $1.57.
Price behavior around the $0.40 barrier will likely determine whether SEI sustains its trend or enters a broader consolidation range going into August.
Why this matters
This research story adds another data point to the current market tape and is useful when read alongside nearby source coverage.
Original source
Read on Brave New CoinRelated market context

Ethereum Price Prediction: Last-Minute Glamsterdam Fix Sets Stage for 200M Gas Jump
Ethereum trades at just under $2,700 as validators prepare for Glamsterdam’s Sepolia activation, which could lift its price predic...

XRP Price Prediction: Chart Mirroring 2016, Targeting $23
XRP trades at around the $1.50 price level, slightly down, but a long-range chart comparison points to a $23 prediction. The resem...

Microsoft Copilot AI Predicts Chainlink (LINK) Could Hit $100 in 2026
Microsoft Copilot AI predicts that in a world where Chainlink becomes the backbone of a major global settlement system, such as SW...

Ethereum Price Prediction: ETH Liquidity Drops 45% Below BTC
Ethereum price prediction is dropping as its order-book depth has fallen to 35–45% of Bitcoin’s. Ethereum trades at $2,725, up 1%...
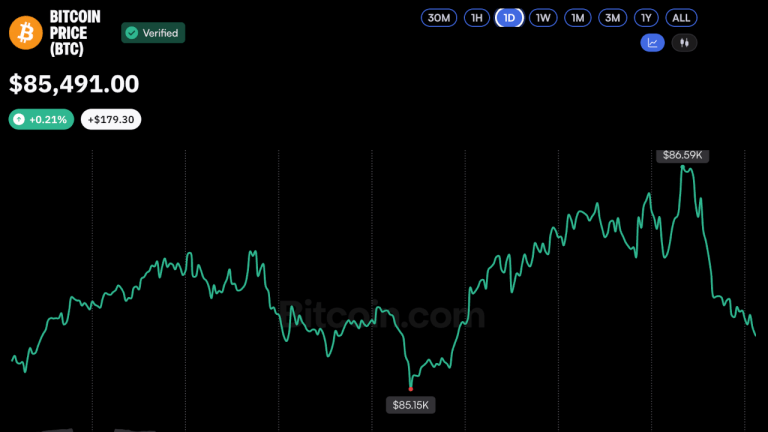
Bitcoin Price Holds October Gains After Two Surges Above $86K
Bitcoin twice rose above $86,000 on Tuesday, supported by momentum from the CFTC’s proposed cryptocurrency regulations and a recen...

Fed Rate Cut Prediction Odds: Polymarket Zero 2026 Fed Cuts Priced
Polymarket priced zero Fed rate cut prediction odds for the remainder of 2026 at 95.9%, or about 96%, as prediction markets and an...