SEI Price Targets $0.33 as Buy Signals Flash on the Charts
The TD Sequential has now triggered a fresh buy signal, hinting that sellers may be losing control. Candles have begun to compress around a narrow support zone, signaling exhaustion in downward pressure. With buyers step...
Archive context
Older archive item. Useful for background and entity history, but not a fresh market-moving signal.

The TD Sequential has now triggered a fresh buy signal, hinting that sellers may be losing control. Candles have begun to compress around a narrow support zone, signaling exhaustion in downward pressure. With buyers stepping in, attention is shifting toward a possible push toward $0.33.
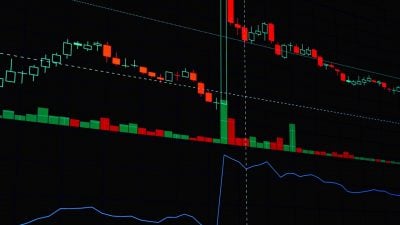
Buy Signals Emerge After a Steep DeclineIn a recent X post, analyst Ali highlighted SEI’s TD Sequential pattern, which has printed a C13 buy signal following days of sustained weakness. The token, anchored near $0.32, reflects waning bearish pressure as smaller-bodied candles replace aggressive selling. A similar signal, marked as “9” earlier on the chart, led to a short-term bounce, adding weight to the bullish setup now forming.
Source: X
The price structure reinforces this view. After cascading red candles, stabilization around the $0.318–$0.320 support range shows that demand is beginning to absorb supply. This standoff between buyers and sellers is a common early sign of a reversal phase, especially when paired with repeating technical signals.
Looking forward, Fibonacci retracement levels point toward $0.326 and $0.334 as immediate hurdles. A breakout past these checkpoints would strengthen the case for a broader rebound, while failure to clear them may trap the crypto in a consolidation cycle. Either way, the $0.33 level now stands as the defining line for the cryptocurrency’s short-term outlook.
Support Levels Under PressureAccording to BraveNewCoin, Sei is currently priced at $0.32, down 6.22% in the last 24 hours, with a market capitalization of $1.98 billion. Trading volume has reached $196 million, reflecting steady activity despite the decline. The token has been moving within a narrow intraday range between $0.315 and $0.335, showing signs of consolidation after recent selling pressure.
Source: BraveNewCoin
The $0.31–$0.32 zone has emerged as a crucial support area, where buyers have stepped in to absorb downward momentum. Holding this floor could pave the way for a rebound toward $0.34–$0.35, while failure to defend it risks extending the downtrend. For now, cryptocurrency’s stability around this level will decide whether the current move is just a pause or the start of a deeper correction.
Technical Indicators Signal Mixed MomentumOn the other hand, the SEI/USDT daily chart reflects a wide trading range between 0.1303 and 0.3903, with the latest price at 0.3194, slightly down 0.68% on the day. Recent candles show consolidation around the 0.32 zone, following earlier bullish momentum spikes in July and September that lifted the token toward higher levels.
Source: TradingView
The MACD offers a mildly bullish signal, with the line at 0.0066 sitting above the signal line at 0.0057, supported by a positive histogram. However, the weak bar size highlights fragile momentum, suggesting buyers lack conviction. Previous crossovers triggered short-lived moves, keeping volatility in focus.
Meanwhile, the RVI sits at 37.78, below its moving average of 47.05, pointing to bearish pressure and weak buying vigor. This indicator, paired with subdued RSI-like readings, suggests sideways or range-bound action in the near term. Unless stronger momentum emerges, the crypto appears likely to hover between its recent support and resistance levels.
Why this matters
This research story adds another data point to the current market tape and is useful when read alongside nearby source coverage.
Original source
Read on Brave New CoinRelated market context

Bitcoin (BTC) Price Today: 2028 Halving Cycle and BlackRock ETF Inflow Signal Long-Term Rally
Recent market data also show that Bitcoin buyers have absorbed a key sell wall around $85,000, reducing one source of near-term re...

Bitcoin Price Prediction: Understanding and Predicting 2026 Uptober
Bitcoin opened October with the familiar “Uptober” trade, and seasonal strength could drive its price prediction. BTC trades at $8...
Coinbase will support the AERO and VELO token migration from November 2 to 4, 2026
The token migration could streamline DeFi operations, enhancing liquidity and governance across multiple blockchain networks. The...

Zcash (ZEC) Price Prediction: Whale Accumulation and ETF Outflows Put ZEC at a Critical Crossroads Around $1,400
The Zcash price reached a September high near $1,687 before retreating toward the $1,400 area. Historical price data shows the tok...

XRP News: $1.49B Unlock Leaves Net Supply Unclear
Ripple is back in the news after releasing 1 billion XRP from escrow in four rapid transactions valued at $1.49 billion, with XRP...

Chainlink And Swift Demo Automated Tokenized-Equity Dividends Across Four Blockchains
TL;DR Chainlink built a Swift Hackathon solution that automated a cash-dividend workflow for tokenized equities across four blockc...